Postgres Log Analysis Expert v8
The Postgres Log Analysis Expert analyzes the log files of servers that are registered with PEM, and produces a report that provides an overview of your Postgres cluster's usage based on log file entries. You can use information on the Log Analysis Expert reports to make decisions about optimizing your cluster usage and configuration to improve performance.
Before invoking the Postgres Log Analysis Expert, you must specify the Service ID on the Advanced tab of the server's properties dialog, and use the Log Manager wizard to enable log collection by the PEM server. To invoke the Log Manager wizard, select the Log Manager... option from the Management menu; check the box next to Import logs to PEM in the Import Logs panel of the wizard to enable log collection.
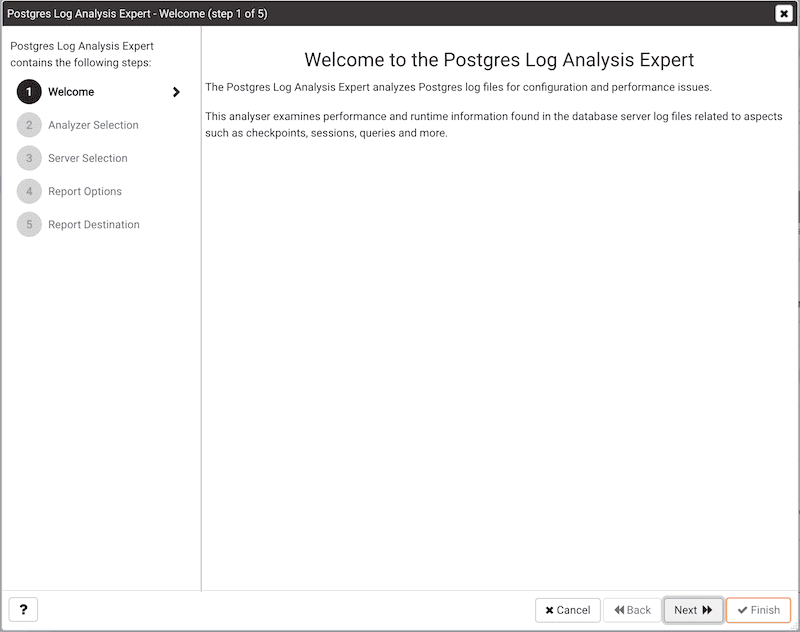
To open the Postgres Log Analysis Expert wizard, select the Postgres Log Analysis Expert... option from the Management menu of the PEM client. When the wizard's Welcome dialog opens, click Next to continue.
The wizard's Analyzer selection dialog displays a list of Analyzers from which you can select. Each Analyzer generates a corresponding table, chart, or graph that contains information gleaned from the log files.
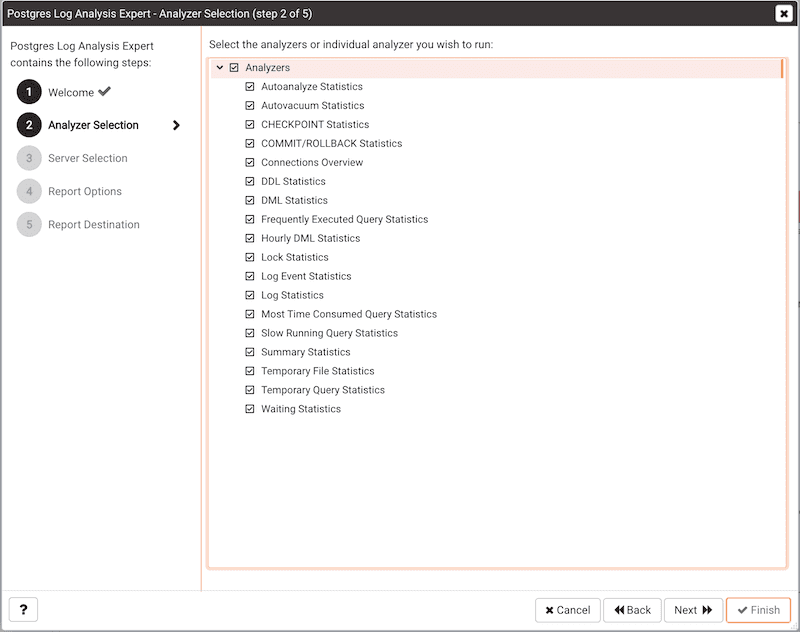
Check the box to the left of an Analyzer to indicate that the Log Analysis Expert should prepare the corresponding table, chart or graph. After making your selections, click Next to continue to the Server selection tree control.
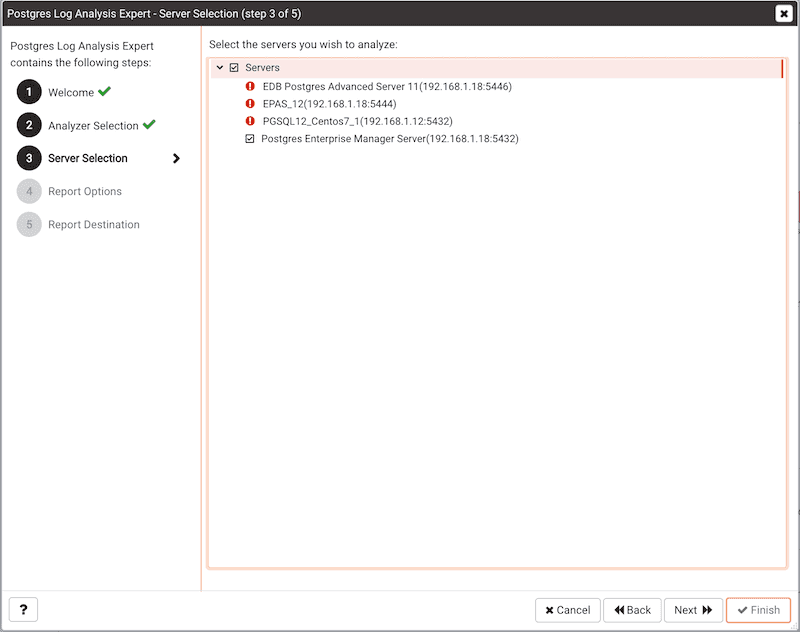
Use the tree control to specify which servers you would like the Postgres Log Analysis Expert to analyze. If you select multiple servers, the resulting report will contain the corresponding result set for each server in a separate (but continuous) list. Click Next to continue.
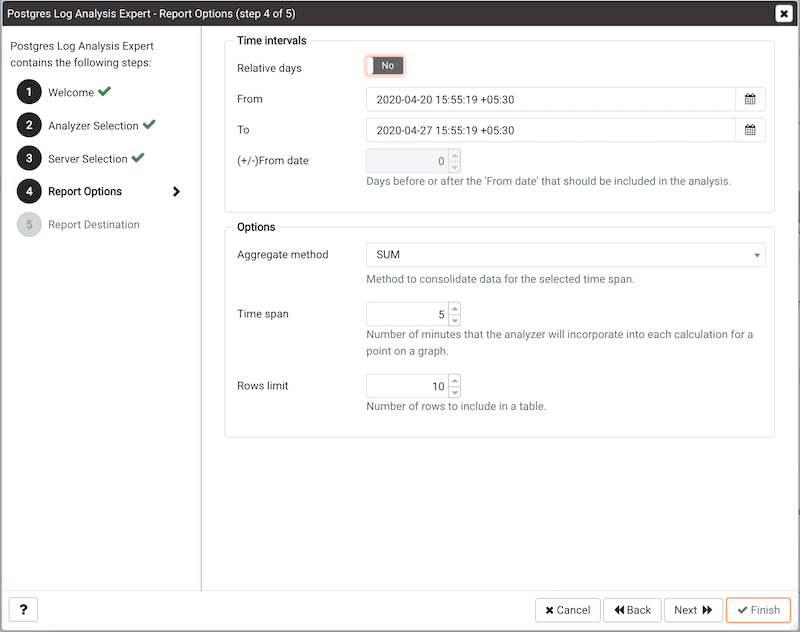
Use the fields in the Options section to specify the analysis method and the maximum length of any resulting tables:
- Use the
Aggregate methoddrop-down to select the method used by the Log Analysis Expert to consolidate data for the selected time span - select from:SUM-SUMinstructs the analyzer to calculate a value that is the sum of the collected values for the specified time span.AVG-AVGinstructs the analyzer to calculate a value that is the average of the collected values for the specified time span.MAX-MAXinstructs the analyzer to use the maximum value that occurs within a specified time span.MIN-MINinstructs the analyzer to use the minimum value that occurs within a specified time span.
- Use the
Time spanfield to specify the number of minutes that the analyzer will incorporate into each calculation for a point on a graph. For example, if theTime spanis '5 minutes', and theAggregate methodis 'AVG', each point on the given graph will contain the average value of the activity that occurred within a five minute time span. - Use the
Rows limitfield to specify the maximum number of rows to include in a table.
Use the fields in the Time Intervals section to specify the time range that the Log Analysis Expert will analyze:
- Set
Relative daystoYesto enable the(+/-)From datefield and specify the number of days before or after the date and time selected in theFromfield. - Use the
Fromfield to specify the starting date and time for the analysis. - Use the
Tofield to specify the ending date and time for the analysis. - Use the
(+/-) From dateselector to specify the number of days before or after theFromdate that should be included in the analysis.
When you've specified the report options, click Next to continue.
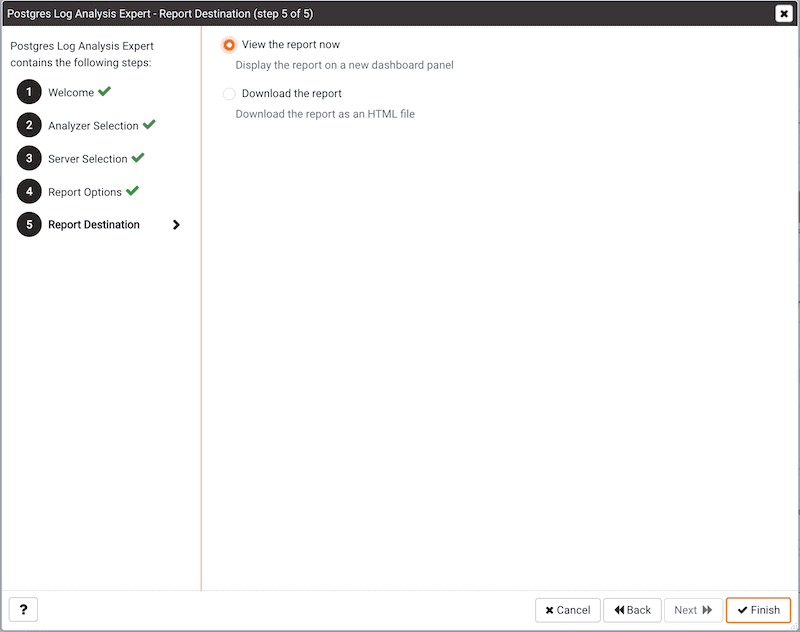
You can select the default option (Finish) to view the Log Analysis Expert report in the PEM client's tabbed browser, or click the radio button next to Download the report to save a copy of the report to an HTML file for later use.
Reviewing the Postgres Log Analysis Expert Report
If you've elected to review the report immediately, the Postgres Log Analysis Expert report will be displayed in the PEM Client window. If the report contains an analysis of more than one monitored server, the graphs will be displayed in sets; first the graphs, tables and charts that display statistics for one server, then the graphs for the next server in the report.
The Postgres Log Analysis Expert Report header displays the date and time that the report was generated, the time period that the report spans, and the Aggregation method specified when defining the report. The name of the server for which information is displayed is noted at the start of each section of the report.
The report displays the tables, graphs and charts that were selected in the Log Analysis Expert wizard. Use the Jump To button (located in the lower-right hand corner of the screen) to navigate to a specific graphic.
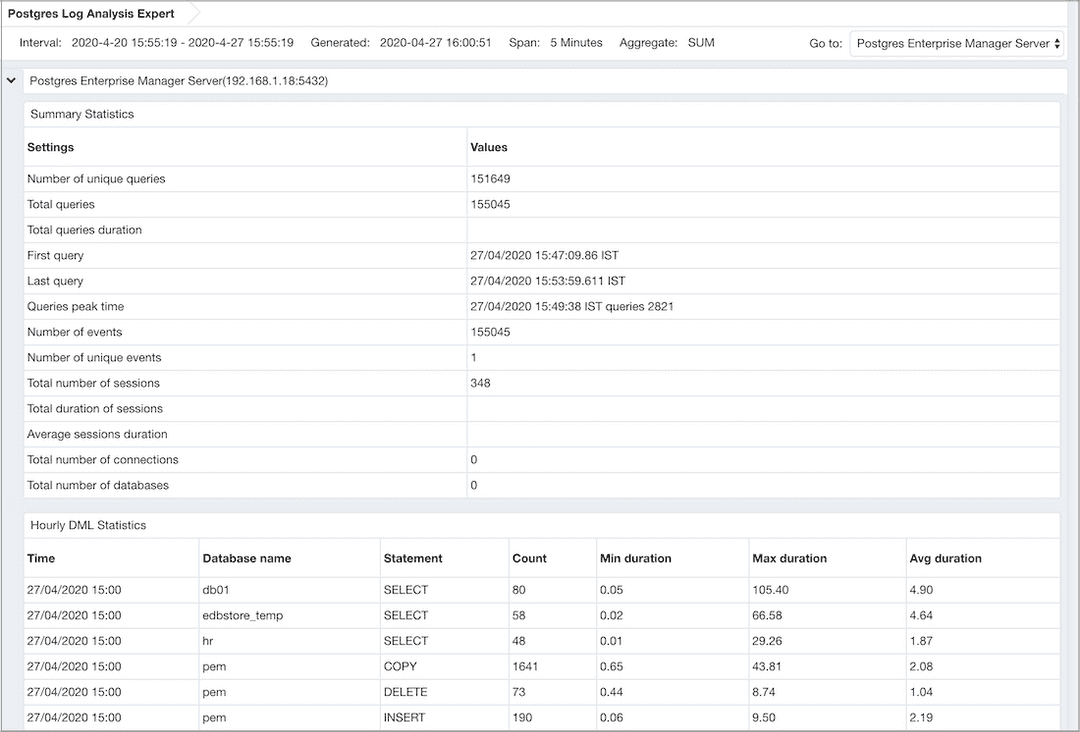
The report may include one or more of the following:
- The
Summary Statisticstable displays a summary of server activity for the selected server.- The
Number of unique queriesrow displays the count of unique queries made against the selected server in the specified time period. - The
Total queriesrow displays the count of queries made against the selected server in the specified time period. - The
Total queries durationrow displays the amount of time used to execute queries against the server. - The
First queryrow displays the time (within the specified time period) that the first query executed against the server. - The
Last queryrow displays the time (within the specified time period) that the last query executed against the server. - The
Queries peak timerow displays the point in time (within the specified time period) that query activity reached it's highest level. - The
Number of eventsrow displays the count of log events within the specified time period. - The
Number of unique eventsrow displays the count of unique server events. - The
Total number of sessionsrow displays a count of the number of sessions recorded within the time period. - The
Total duration of sessionsrow displays the amount of time that sessions were connected (during the specified time period). - The
Average sessions durationrow displays the average length of each session. - The
Total number of connectionsrow displays the number of user connections made to the server. - The
Total number of databasesrow displays the number of databases on the selected server.
- The
- The
Hourly DML Statisticstable displays the statistics related to the use of various DML commands (SELECT, INSERT, UPDATE, DELETE, COPY and FETCH) within a one-hour period. To generate values in theMin Duration(sec),Max Duration(sec), andAvg Duration(sec)columns of this table, you must specify a value greater than or equal to0in the log_min_duration_statement configuration parameter. You can set the parameter by either modifying thepostgresql.conffile with your editor of choice, or by specifying a value of0or greater in theLog Min Duration Statementfield of theLog Managerwizard.- The
Timecolumn displays the start of the one-hour period for which data was analyzed. - The
Databasecolumn displays the name of the database in which the specified DML command executed. - The
Command Typecolumn displays the DML command type. - The
Total Countcolumn displays the number of times that a command of the specified command type executed during the one-hour period analyzed by the report. - The
Min Duration(sec)column displays the shortest amount of time (in seconds) used by the server to respond to the specified command type. - The
Max Duration(sec)column displays the longest amount of time (in seconds) used by the server to respond to the specified command type. - The
Avg Duration(sec)column displays the average length of time (in seconds) used by the server when responding to the specified command type.
- The
- The
DML Statistics Timelinesection of the Log Analysis Expert report displays information about DML statement usage:- The line graph displays an analysis of statement usage during the selected time period. Hover over a specific point to view detailed information about that point on the graph.
- The pie chart displays the percent of statement usage of each respective DML statement type during the selected time period.
- The
DDL Statistics Timelinesection of the Log Analysis Expert report displays information about DDL statement usage:- The line graph displays an analysis of statement usage during the selected time period. Hover over a specific point to view detailed information about that point on the graph.
- The pie chart displays the percent of statement usage of each respective DDL statement type during the selected time period.
- The
Commit and Rollback Statistics Timelinesection of the Log Analysis Expert report displays information about the COMMIT, ROLLBACK, and SAVEPOINT statements logged during the specified time period:- The line graph displays an analysis of the commit and rollback activity during the specified time period. Hover over a specific point to view detailed information about that point on the graph.
- The pie chart displays the comparative percent of COMMIT, SAVEPOINT, or ROLLBACK statements executed during the specified time period.
- The
Checkpoint Statistics Timelinesection of the Log Analysis Expert report displays information about the checkpoint operations logged during the specified time period:- The line graph displays an analysis of the checkpoint operation activity during the specified time period. Hover over a specific point to view detailed information about that point on the graph.
- The pie chart displays the comparative percent of different types of checkpoint activity logged during the specified time period.
- The
Log Event Statisticstable lists log entries with a severity level of WARNING, ERROR, FATAL, PANIC, HINT or CONTEXT. The level of logging detail for error messages is controlled by thelog_min_error_statementparameter. You can set the parameter by either modifying thepostgresql.conffile with your editor of choice, or by specifying a value in theLog Min Error Statementfield of theLog Managerwizard.- The
Error Severitycolumn lists the severity level of the log entry. - The
Messagecolumn lists the log message. - The
Total Countcolumn lists the number of times that the log entry has occurred.
- The
- The
Log Statisticstable lists log entries that indicate an operational severity level of LOG, DETAIL, DEBUG, NOTICE, INFO or STATEMENT. The level of logging detail for informational messages is controlled by thelog_min_messagesparameter. You can set the parameter by either modifying thepostgresql.conffile with your editor of choice, or by specifying a value in theLog Min Messagesfield of theLog Managerwizard.- The
Error Severitycolumn lists the severity level of the log entry. - The
Total Countcolumn lists the number of times that the log entry has occurred.
- The
- The
Temp Generated Queriestable displays a list of queries that have created temporary files.- The
Log Timecolumn displays the time that the log entry was generated. - The
TempFile Size(Bytes)column displays the size of the temporary file in bytes. - The
Querycolumn displays the text of the query that created the temporary file.
- The
- The
Temp File Statistics Timelinegraph displays the size of temporary files over the specified time period. Hover over a specific point to view detailed information about that point on the graph. - The
Lock Statistics Timelinesection of the Log Analysis Expert report displays information about the locks held during the specified time period:- The graph displays the number of locks held at any given point during the time period. Hover over a specific point to view detailed information about that point on the graph.
- The pie chart displays the relative percentage of each type of lock used during the selected time period.
- The
Waiting Statistics Timelinesection of the Log Analysis Expert report displays information about DML statements that are waiting for a lock during the specified time period:- The graph displays the number of DML statements that are waiting at any given point during the time period; each colored line represents a statement type. Hover over a specific point to view detailed information about that point on the graph.
- The pie chart displays the relative percentage of each type of DML statement that waited for a lock during the selected time period.
- The
Idle Statistics Timelinesection of the Log Analysis Expert report displays information about the amount of time that a connection to the server is idle. AnIDLEserver is waiting for a connection from a client. A connection that isIDLE in transactionhas started a transaction, but has not yet committed or rolled back the transaction and is waiting for a command from the client. A session that is IDLE in transaction (aborted)* has started a transaction, but has not yet committed or rolled back the transaction and is waiting for a command from the client; an error has occurred within the transaction and the transaction can only be rolled-back.- The graph displays the times at which the server is
IDLE,IDLE in transaction, andIDLE in transaction (aborted). Hover over a specific point to view detailed information about that point on the graph. - The pie chart displays the relative percentage of each type of lock used during the selected time period.
- The graph displays the times at which the server is
- The
Autovacuum Statisticstable displays statistics about autovacuum activity on monitored servers.- The
Log Timecolumn displays the time that the autovacuum activity was written to the log. - The
Relationcolumn displays the name of the table on which the autovacuum was performed. - The
Index Detailscolumn displays the number of index scans that were performed. - The
Page Detailscolumn displays the number of pages that were removed, and the number of pages that remain. - The
Tuple Detailscolumn displays the number of tuples that were removed, and the number of tuples that remain. - The
Buffer Usagecolumn displays the number of buffers hit, missed, or dirty. - The
Read Ratecolumn displays the average read rate in MB's per second. - The
System Usagecolumn displays the percent of CPU time used performing autovacuum activities.
- The
- The
Autoanalyze Statisticstable displays logged autoanalyze activity.- The
Log Timecolumn displays the time that the autoanalyze activity was written to the log. - The
Relationcolumn displays the name of the table on which the autoanalyze was performed. - The
System Usagecolumn displays the percent of CPU time used performing autoanalyze activities.
- The
- The
Slow Query Statisticstable displays the slowest queries executed on monitored servers. The table will include the number of entries specified in theRows Limitfield of the Log Analysis Expert.- The
Log Timecolumn displays the time that the query activity was written to the log. - The
Tagcolumn displays the command type. - The
Querycolumn displays the text of the performed query. - The
Parameterscolumn displays the parameters (if the query is a parameterized query). - The
Durationcolumn displays the length of time that it took the server to execute the query. - The
Hostcolumn displays name of the host on which the query executed. - The
Databasecolumn displays the name of the database on which the query executed.
- The
- The
Frequently Executed Query Statisticstable displays the most frequently executed query statements. The table will include the number of entries specified in theRows Limitfield of the Log Analysis Expert.- The
Querycolumn displays the text of the performed query. - The
Parameterscolumn displays the parameters (if the query is a parameterized query). - The
No. of Times Executedcolumn displays the number of times that the query executed. - The
Total Durationcolumn displays the length of time that it took the server to execute the query.
- The
- The
Most Time Executed Query Statisticstable displays the queries that took the most execution time on the server. The table will include the number of entries specified in theRows Limitfield of the Log Analysis Expert.- The
Querycolumn displays the text of the performed query. - The
Parameterscolumn displays the parameters (if the query is a parameterized query). - The
No. of Times Executedcolumn displays the number of times that the query executed. - The
Total Durationcolumn displays the length of time that it took the server to execute the query.
- The
- The
Connections Overview Timelinesection of the Log Analysis Expert report displays information about successful and unsuccessful connection attempts during the specified time period:- The
Timestampgraph displays the number of server connections attempted and connections authenticated at any given point during the specified time period. Hover over a specific point to view detailed information about that point on the graph. - The
Summarypie chart displays the relative percentage of connections attempted and connections authenticated during the specified time period.
- The