Creating a Custom Dashboard v8
You can use the PEM dashboard editor to create or modify a user-defined dashboard. The custom dashboard may include pre-defined charts, user-defined charts or a mix of pre-defined and user-defined charts. To create a new dashboard, select Create New Dashboard... from the Quick Links section of the Manage Dashboards tab.
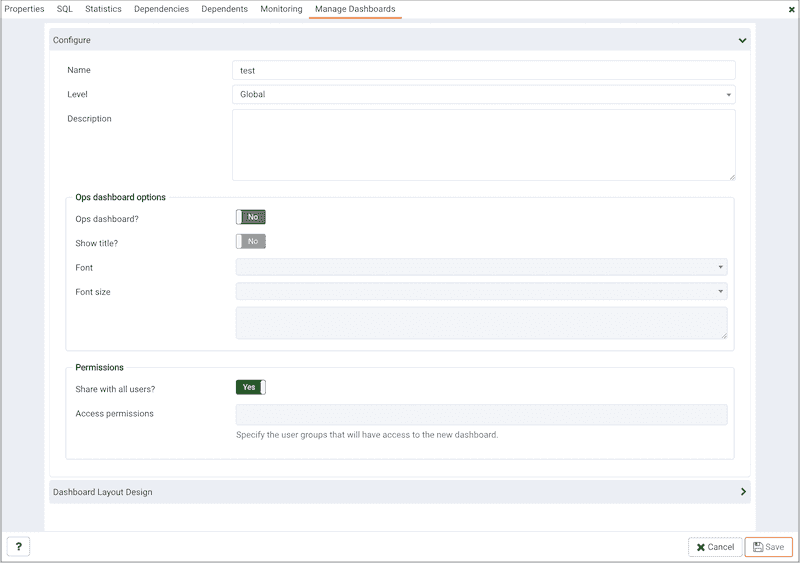
Use the fields in the Configure section to specify general information about the dashboard:
- Specify a name for the dashboard in the
Namefield. The name specified will also be the title of the dashboard if the title is displayed. - Use the
Leveldrop-down listbox to specify the level of the PEM hierarchy within the PEM client on which the dashboard will be displayed. A dashboard may be accessed via theDashboardsmenu on aGloballevel, anAgentlevel, theServerlevel or theDatabaselevel. Each selected level within the list will expose a different set of metrics on which the custom dashboard's charts may be based. - Provide a description of the dashboard in the
Descriptionfield.
Provide information in the fields in the Ops dashboard options box if the dashboard will be used as an Ops dashboard:
- Set the
Ops Dashboard?field toYesto instruct the server to create a dashboard that is formatted for display on an Ops monitor. - Set the
Show Title?field toYesto display the dashboard name at the top of the Ops dashboard. - Use the
Fontdrop-down list box to select a custom font style for the title. The selected font style will be displayed in thePreviewbox. - Use the
Font sizedrop-down list box to select a custom font size for the title. The selected font style will be displayed in thePreviewbox.
Use the Permissions box to specify the users that will be able to view the new dashboard:
- Set the
Share with allslider toYesto instruct the server to allow allTeamsto access the dashboard, or setShare with alltoNoto enable theAccess permissionsfield. - Use the
Access permissionsfield to specify which roles can view the new dashboard. Click in the field, and select from the list of users to add a role to the list of users with dashboard access.
When you've completed the Configure Dashboard section, click the arrow in the upper-right corner to close the section, and access the Dashboard Layout Design section.
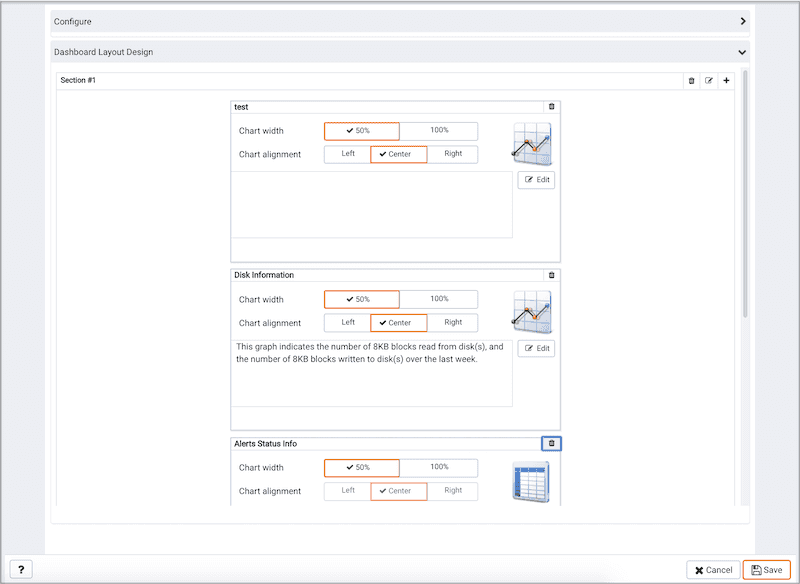
Click the edit icon in a section header to specify a section name; then, click the add icon (+) to add a chart to the section.
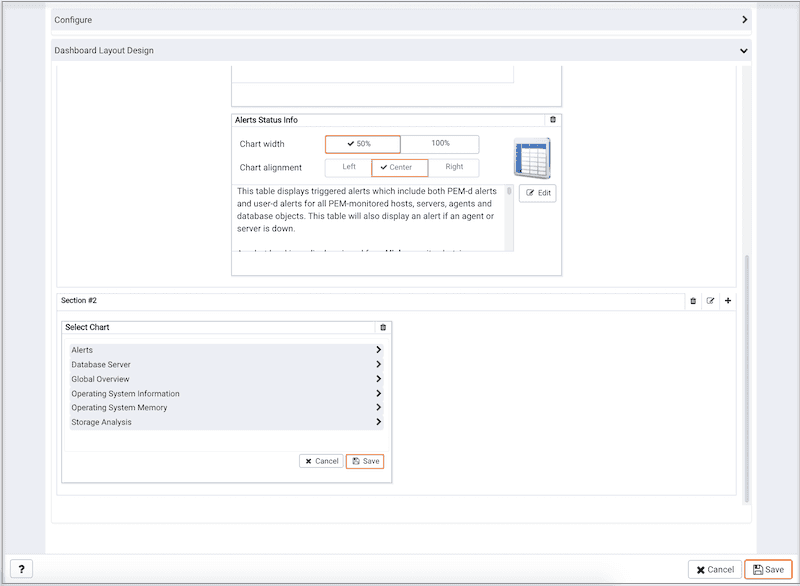
Use the arrows to the right of each chart category to display the charts available and select a chart.
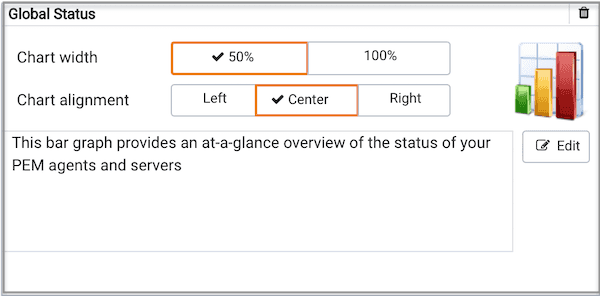
Use the chart detail selectors to specify placement details for the chart: * Use the Chart width selector to indicate the width of the chart; select 50% to display the chart in half of the dashboard, or 100% to use the whole dashboard width. * Use the Chart alignment selector to indicate the position of the chart within the section:
- Select
Leftto indicate that the chart should be left-justified. - Select
Centerto indicate that the chart should be centered. - Select
Rightto indicate that the chart should be right-justified.
Please note that tables are always displayed centered.
When creating or editing a custom dashboard, you can use drag and drop to re-arrange the charts within a section or to move a chart to a different section.
To add another chart to your dashboard, click the add icon (+) in the section header. When you've finished editing the dashboard, click the Save button to save your edits and exit.
To exit without saving your changes, click the Cancel button.
Exporting or Importing a Dashboard
From PEM 8.3 onwards, you can export or import the dashboards to another PEM Server.
To Export a dashboard, select any dashboard from the Dashboards tab and then select the Export icon in the upper-right corner of the table. Select Save File option and then select ok, it will generate the JSON file.
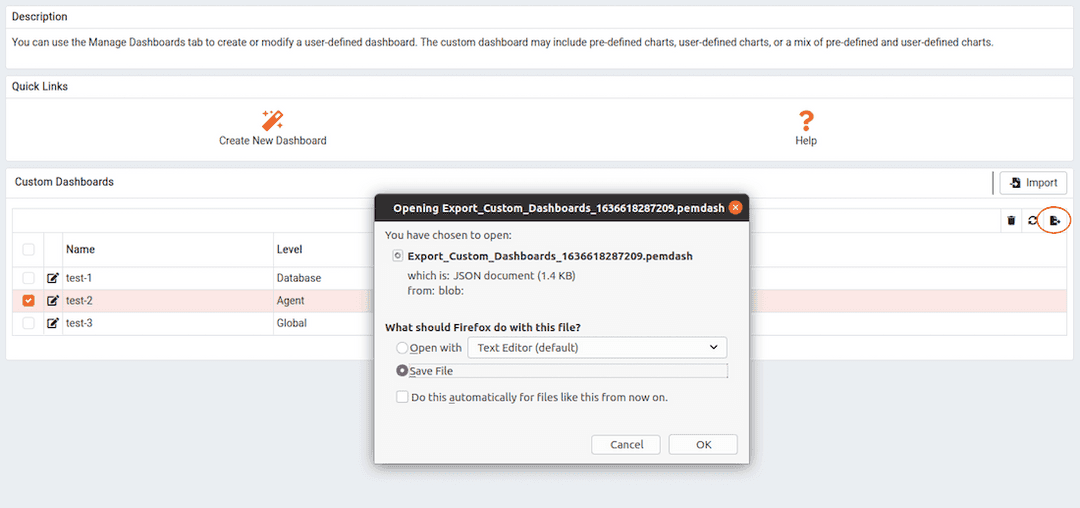
To Import a dashboard, go to the Dashboards tab and then select the Import icon in the upper-right corner.

Click on the Browse button to select the JSON file with the code to be imported and then click Import.
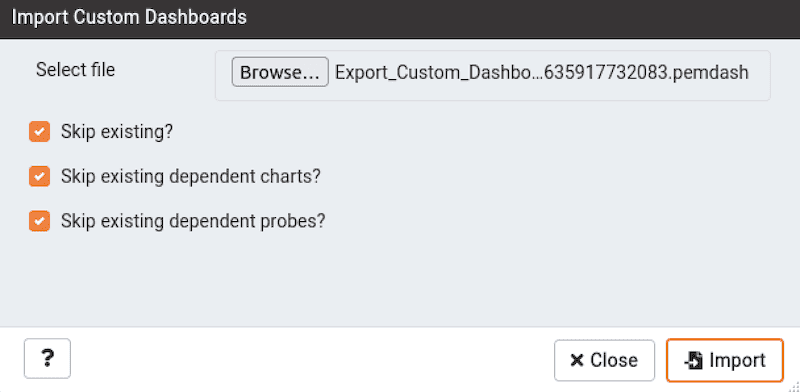
After selecting the file to import, you can select the following checkboxes:
skip existing- If you select this checkbox then it will skip the dashboard if it already exists.skip existing dependent charts- The dashboards are dependent on charts. If you select this checkbox then it will skip the dependent chart if it already exists.skip existing dependent probes- The dashboards are dependent on probes. If you select this checkbox then it will skip the dependent probe if it already exists.
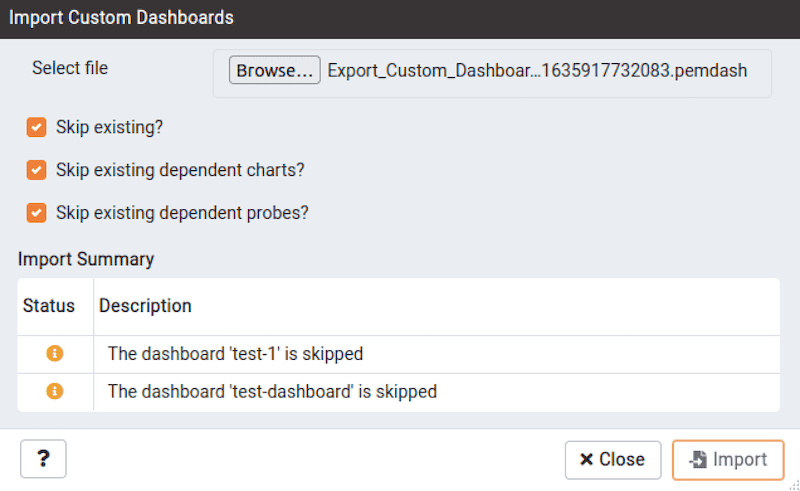
If all the checkboxes are selected and the dashboard already exists, then it skips importing the dashboard with below message:
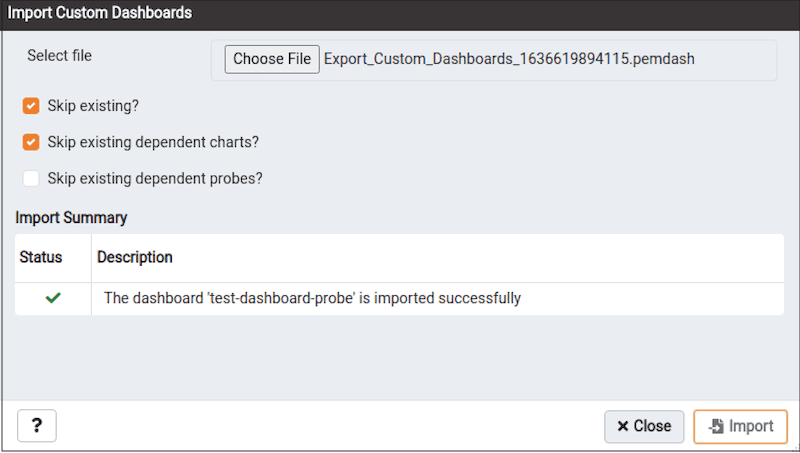
If the skip existing, skip existing dependent charts checkboxes are not selected and skip existing dependent probes is selected and the dashboard already exists, then it will import the dashboard successfully as below:
If only skip existing checkbox is selected then it skips importing the dashboard with below message:
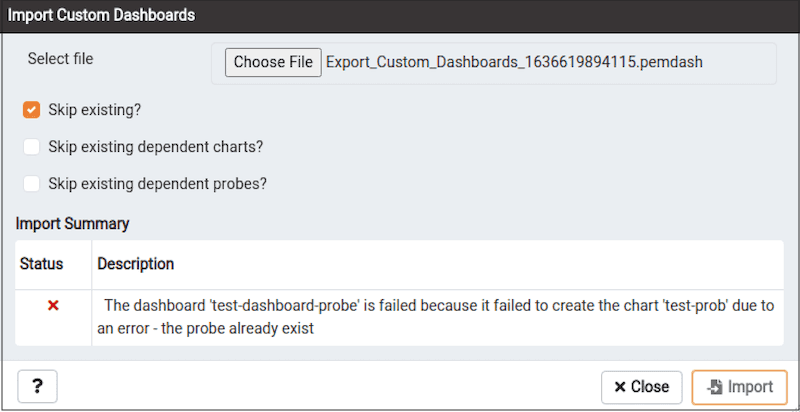
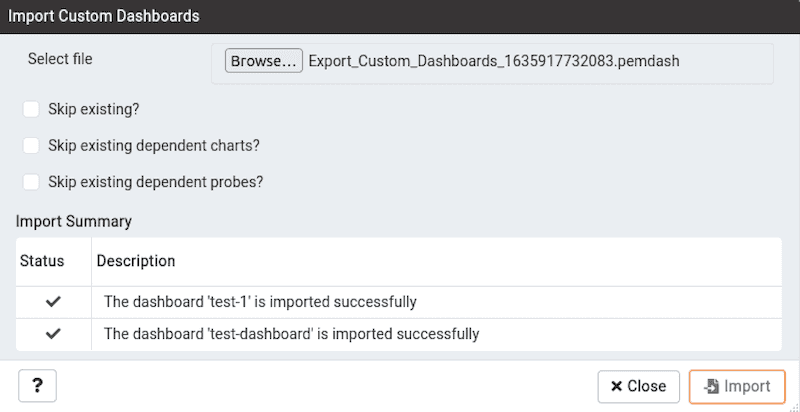
If all the checkboxes are not selected and the dashboard does not exist, then it will successfully import the dashboard as below:
Deleting a Dashboard
To delete a dashboard, select the name in the dashboards table, and click the Delete icon (located to the upper-right corner of the table).