Custom Probes v8
Use the Custom Probes tab to create a new probe or modify an existing probe. After creating or modifying a probe, you can incorporate the data gathered by custom probes into existing or new charts or graphs. To open the Custom Probes tab, select the Manage Custom Probes icon from the Quick Links section of the Manage Probes tab.
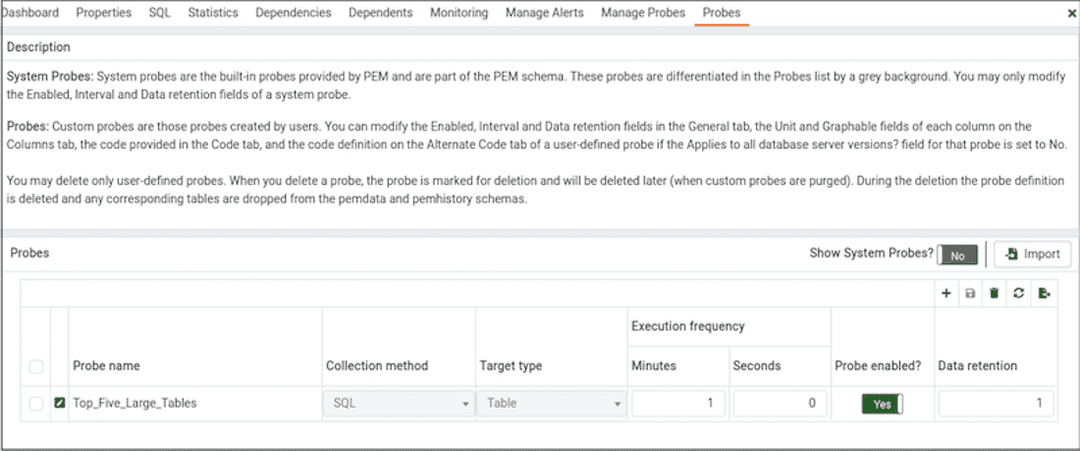
Use the Show system probes? switch to display the system probes on the Custom Probes tab.
To modify an existing probe, click the Edit icon located to the left of a probe name.
Defining a New Probe
To create a new probe, click the Add icon in the upper-right corner of the tab.
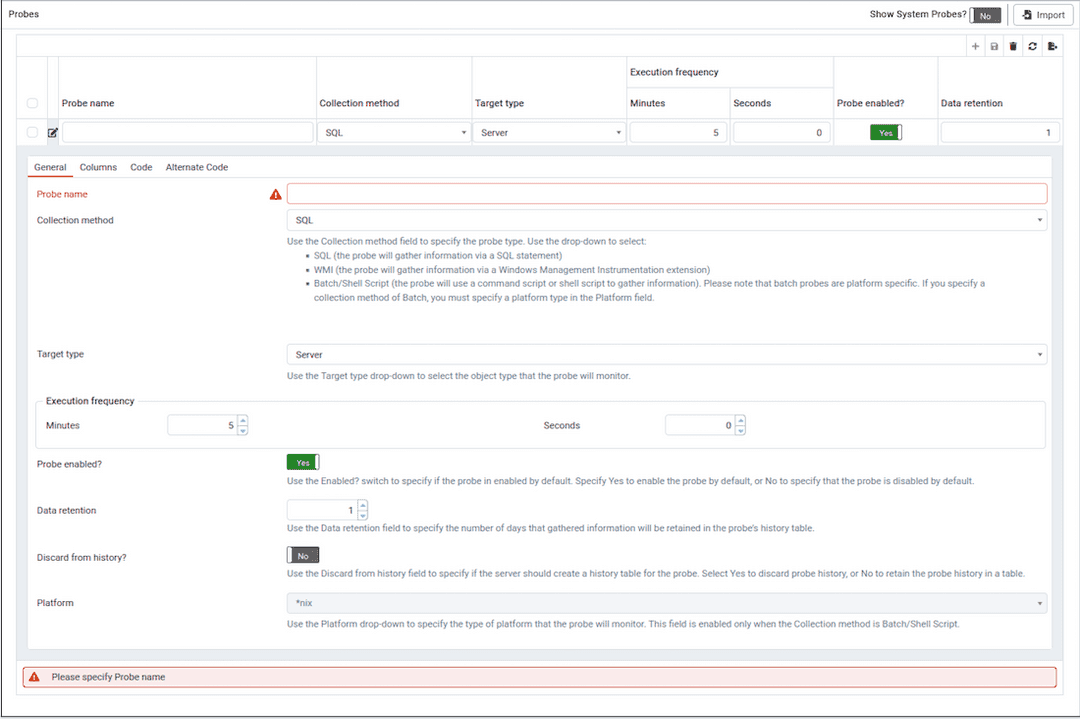
Use the fields on the General tab to modify the definition of an existing probe or to specify the properties of a new probe.
Use the
Probe namefield to provide a name for a new probe.Use the
Collection methodfield to specify the probe type. Use the drop-down listbox to select from:SQL(the probe will gather information via a SQL statement)WMI(the probe will gather information via a Windows Management Instrumentation extension)Batch/Shell Script(the probe will use a command-script or shell-script to gather information).Before creating a batch probe on a Linux system, you must modify the
agent.cfgfile, setting theallow_batch_probesparameter equal totrueand restart the PEM agent. Theagent.cfgfile is located in/opt/PEM/agent/etc.On Windows systems, agent settings are stored in the registry. Before creating a batch probe, modify the registry entry for the
AllowBatchProbesregistry entry and restart the PEM agent. PEM registry entries are located inHKEY_LOCAL_MACHINE\Software\EnterpriseDB\PEM\agent.Please note that batch probes are platform-specific. If you specify a collection method of
Batch, you must specify a platform type in thePlatformfield.
To invoke a script on a Linux system, you must modify the entry for
batch_script_userparameter of agent.cfg file and specify the user that should be used to run the script. You can either specify a non-root user or root for this parameter. If you do not specify a user, or the specified user does not exist, then the script will not be executed. Restart the agent after modifying the file. If pemagent is being run by a non-root user then the value ofbatch_script_userwill be ignored and the script will be executed by the same non-root user that is being used for running the pemagent.Use the
Target typedrop-down listbox to select the object type that the probe will monitor.Target typeis disabled ifCollection methodisWMI.Use the
MinutesandSecondsselectors to specify how often the probe will collect data.Use the
Probe enable?switch to specify if the probe is enabled. SpecifyYesto enable the probe, orNoto specify that the probe is disabled.Set the
Data retentionswitch toYesto specify the number of days that gathered information will be retained in the probe's history table.Use the switch next to
Discard from historyto specify if the server should create a history table for the probe. SelectYesto discard probe history, orNoto retain the probe history in a table.Use the
Platformdrop-down listbox to specify the type of platform that the probe will monitor. This field is enabled only when theCollection methodisBatch.
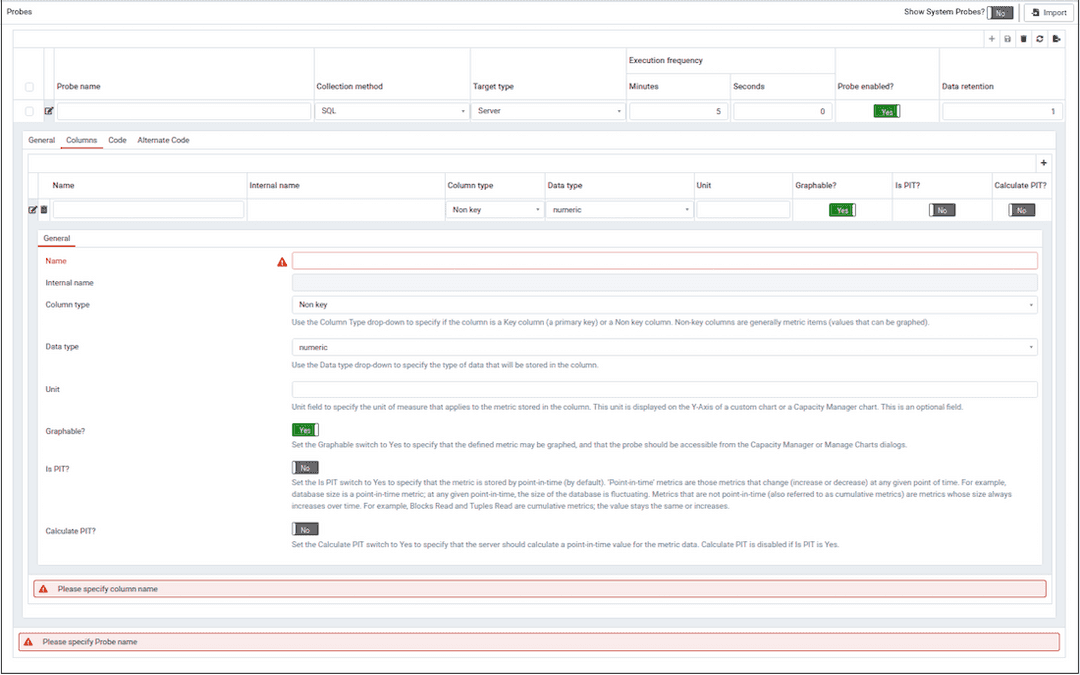
Use the Columns tab to define the columns in which the probe data will be stored. Navigate to the Columns tab, and click the Add button (in the upper-right corner) to define a new column.
Provide a name for the column in the
Namefield.The
Internal namefield is not enabled for user-defined probes.Use the
Column typedrop-down listbox to specify if the column is aKeycolumn (a primary key) or aNon keycolumn. Non-key columns are generally metric items (values that can be graphed).Use the
Data typedrop-down listbox to specify the type of data that will be stored in the column.Use the
Unitfield to specify the unit of measure that applies to the metric stored in the column. This unit is displayed on the Y-Axis of a custom chart or a Capacity Manager chart. This is an optional field.Use the
Graphableswitch to specify if the defined metric may be graphed, and that the probe should be accessible from the Capacity Manager or Manage Charts dialogs.Use the
Is PITswitch to specify if the metric is stored by point-in-time (by default).'Point-in-time' metrics are those metrics that change (increase or decrease) at any given point of time. For example, database size is a point-in-time metric; at any given point-in-time, the size of the database is fluctuating. Metrics that are not point-in-time (also referred to as cumulative metrics) are metrics whose size always increases over time. For example, Blocks Read and Tuples Read are cumulative metrics; the value stays the same or increases.
Use the
Calculate PITswitch to specify that the server should calculate a point-in-time value for the metric data.Calculate PITis disabled ifIs PITisYes.
PEM allows you to store point-in time-values of cumulative metrics as well. PEM subtracts the last collected value of a cumulative metric from the current value, and stores the difference as a point-in-time value.

Use the Code tab to specify the default code that will be executed by the probe.
If the probe is a SQL probe, you must specify the SQL SELECT statement invoked by the probe on the
Codetab. The column names returned by the query must match theInternal Namespecified on theColumntab. The number of columns returned by the query, as well as the column name, datatype, etc. must match the information specified on theColumnstab.If the probe is a Batch probe, you must specify the shell or .bat script that will be invoked when the probe runs. The output of the script should be as follows:
- The first line must contain the names of the columns provided on the
Columnstab. Each column name should be separated by a tab (t) character. - From the second line onwards, each line should contain the data for each column, separated by a tab character.
- If a specified column is defined as key column, make sure the script does not produce duplicate data for that column across lines of output.
- The number of columns specified in the
Columnstab and their names, data type, etc. should match with the output of the script output.
- The first line must contain the names of the columns provided on the
If the probe is a WMI probe, you must specify the WMI query as a SELECT WMI query. The column name referenced in the SELECT statement should be same as the name of the corresponding column specified on the
Columntab. The column names returned by the query must match theInternal Namespecified on theColumntab. The number of columns returned by the query, as well as the column name, datatype, etc. must match the information specified on theColumnstab.
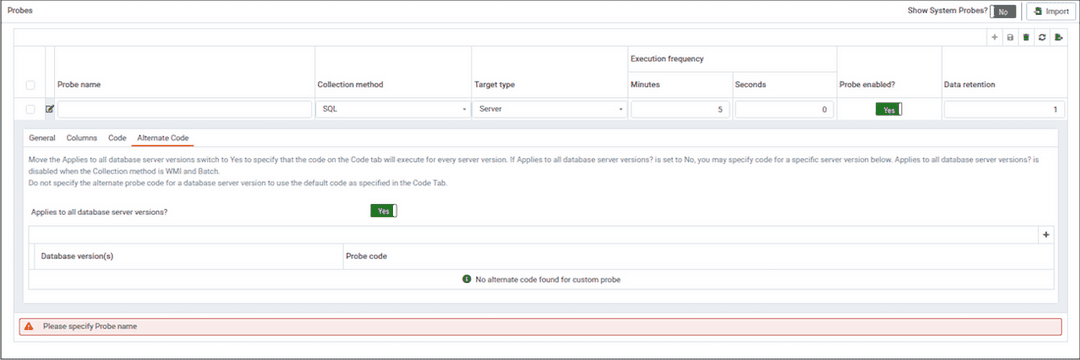
Use the Alternate Code tab to provide code that will be invoked if the probe fires on a specific version of the server. To provide version-specific code, move the Applies to all database server versions? switch to No, and click the Add button. Then, use the Database version(s) drop-down listbox to select the version to which the code will apply. After selecting the version, click the Edit button (to the left of the version name) to provide the code that will execute when the probe fires.
If you select a database version, and leave the Probe code column blank, PEM will invoke the code specified on the Code tab when the probe executes on a server that matches that version.
When you've finished defining the probe, click the Save icon (in the corner of the Custom Probes tab) to save the definition, and make the probe data available for use on custom charts and graphs.
Exporting and Importing Probes
From PEM 8.2 onwards, you can export and import the probes to another PEM Server.
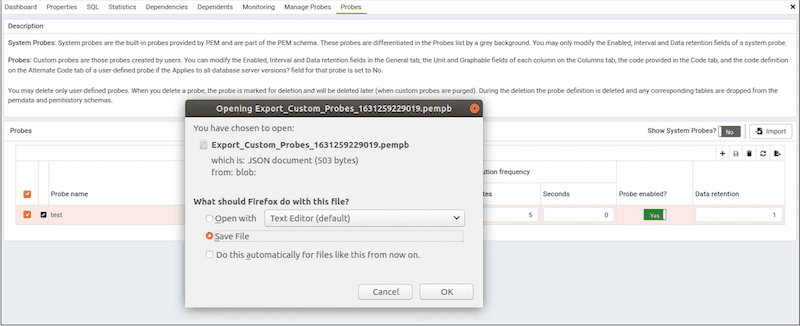
To Export the probe, select any probe/s from the Manage Custom Probes tab and then select the Export icon in the upper-right corner of the table. Select Save File option and then select ok, it will generate the JSON file.
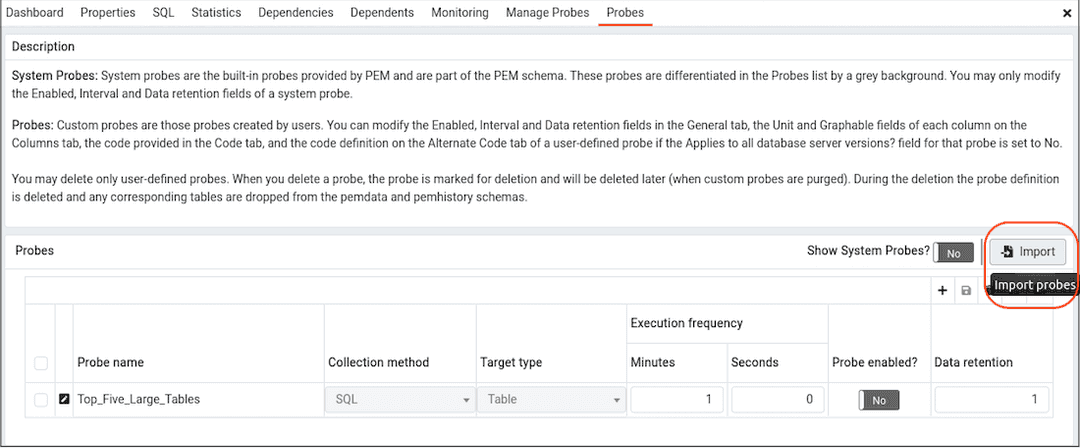
To Import the probe, go to the Manage Custom Probes tab and then select the Import icon in the upper-right corner of the table.
Click on the Browse button to select the JSON file with the probe code to be imported and then click Import.
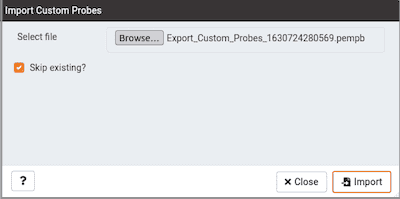
After selecting the file to import you can select the skip existing checkbox. If selected then it will skip the probe if it already exists.
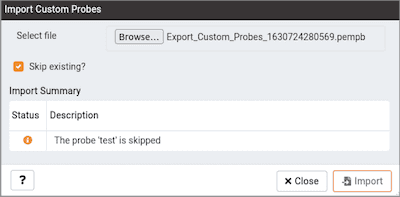
If the checkbox is selected and the probe already exists, then it skips importing the probe with the message as below:
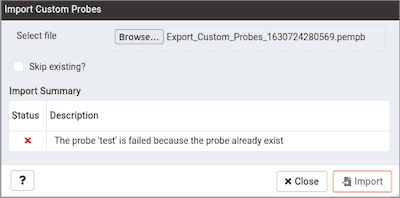
If the checkbox is not selected and the probe already exists, then it does not import the probe and throws the below error:
Note
Import cannot overwrite the existing probe as it may be configured to retain historical data as per the configured retention policy.
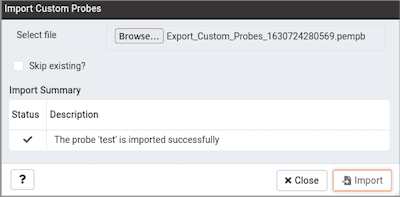
If the checkbox is not selected and probe does not exist but the corresponding table in the pem schema exists, then it imports the probe successfully using the same table.
Note
It is possible that probe is deleted and not listed on Manage Custom Probe tab, but still the table holding the data of that probe exists in the pem schema.
Deleting Probes
You may delete only user-defined probes. To delete a probe, select the probe name in the probes table, and select the Delete icon (located to the upper-right corner of the table). The probe history will persist for the length of time specified on the History Retention field in the probe definition. During the deletion the probe definition is deleted and any corresponding tables are dropped from the pemdata and pemhistory schemas.
System probes are the built-in probes provided by PEM, and are part of the PEM schema. You may only modify system probes; if you attempt to delete a system probe, you will receive an error from PEM.