The Audit Log Analysis Dashboard v8
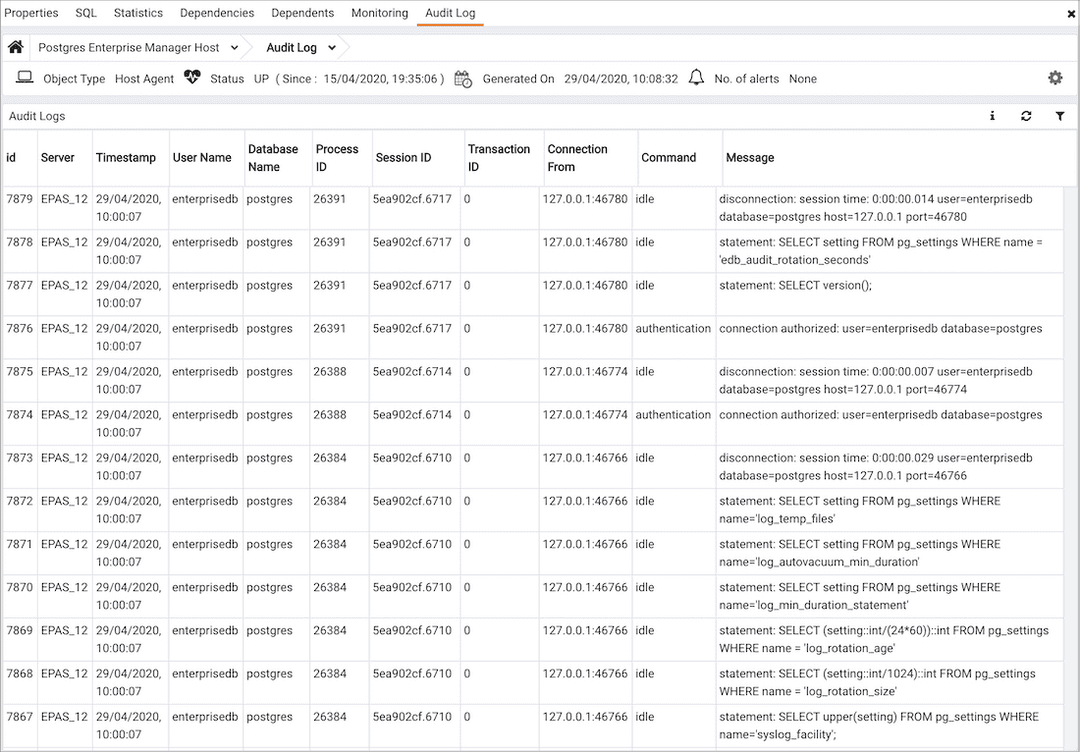
The Audit Log Dashboard allows you to browse the audit logs that have been collected from Advanced Server instances which have enabled audit logging and collection with the Audit Manager. If the Audit Log Dashboard is opened from the Global level, it will display logs from all servers. If opened from the Agent level, it will show logs from all servers monitored by that Agent. If opened from the Server level, it will show logs from that server only.

The Audit Log Dashboard header includes the date and time that the page was last updated, and a current count of triggered alerts.
Audit Log table entries are loaded on demand in batches; to load additional entries, scroll to the end of the log and the additional rows will be automatically loaded from the database and added to the table. Log entries are show in chronological order, most recent first.
- The
Idcolumn identifies the PEM agent that monitors the server that initiated the recorded transaction. - The
Servercolumn identifies the server that initiated the recorded transaction. - The
Timestampcolumn shows the date and time that the log entry was made. - The
User Namecolumn shows the user which executed the statment in the audit log entry. - the
Database Namecolumn shows the database on which the statment in the audit log entry was executed. - The
Process IDcolumn shows the ID of the process which executed the statement in the audit log entry. - The
Session IDcolumn shows the ID of the session in which the statement in the audit log entry was executed. - The
Transaction IDcolumn shows the ID of the transaction in which the statement in the audit log entry was executed. - The
Connection Fromcolumn shows the client's address from where the session was connected. - The
Commandcolumn shows the type of command executed. - The
Messagecolumn shows the message associated with the audit log entry.
Click Show Filters to display a panel that you can use to filter the audit log entries that are shown in the table below; click on Hide Filters to close the panel.

Use the fields within the filter definition box to describe a selection criteria that PEM will use to select a subset of a report for display:
- Use the date and time selectors in the
Fromfield to specify a starting date and time for the displayed log entries. - Use the date and time selectors in the
Tofield to specify an ending date and time for the displayed log entries. - Enter a username in the
Usernamefield to show log entries for the specified user only. - Enter a database name in the
Databasefield to show log entries for the specified database only. - Enter a command type (for example; 'SELECT', 'authentication' or 'idle') in the
Command Typefield to show log entries of that type only.