The Database Analysis Dashboard v8
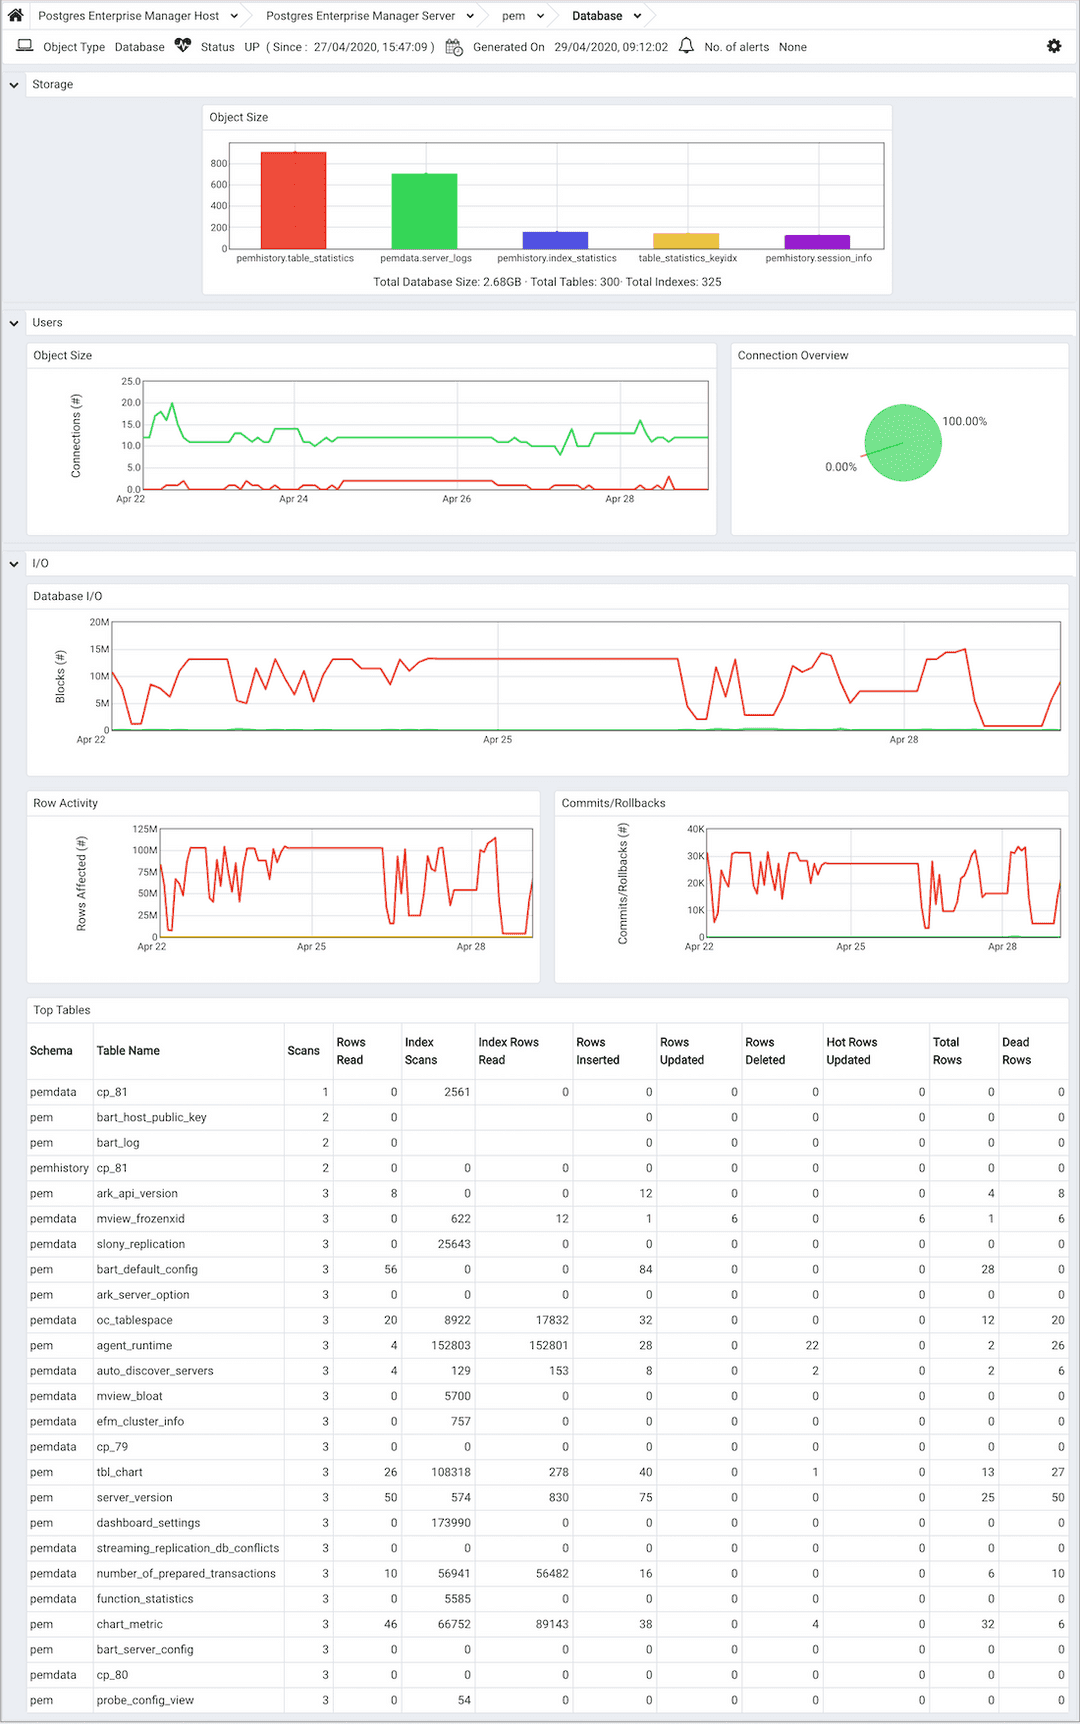
The Database Analysis dashboard provides a high-level overview of database activity for the selected database, including a comparative storage analysis of the 5 largest tables/indexes, user activity analysis, weekly I/O analysis, and an activity analysis of the tables that reside in the selected database.

Use parameters on the PEM Server Configurations dialog to specify the auto-refresh rate for the dashboard. To access the Server Configuration dialog, select Server Configuration... from the PEM web interface Management menu.
The Database Analysis dashboard header displays the date and time that the server started, the date and time that the Database Analysis dashboard was last updated, and the number of alerts currently triggered for the specified database (and monitored objects that reside within that database).
The Storage bar graph plots the relative size of the 5 largest tables and indexes that reside within the selected database. The vertical key on the left side of the graph indicates each table or index in megabytes; the key on the right side of the chart identifies the tables and indexes by name.
The Users section of the Database Analysis dashboard displays information about user connections:
- The
User Activitygraph plots the active and idle connections over the previous week. The vertical key on the left side of the chart indicates the connection count. - The
Connection Overviewchart provides a comparative display of the active and idle connections currently established with the server (when the most recent probe executed).
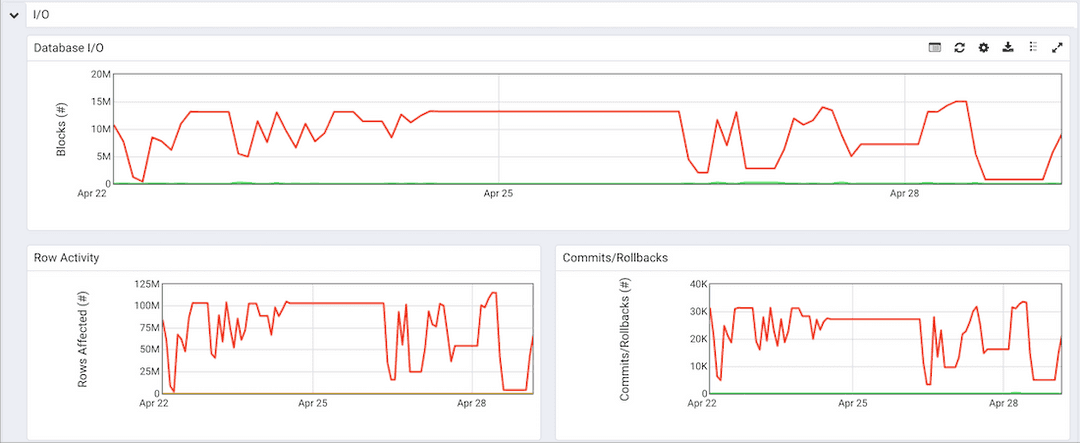
The graphs in the I/O section present an analysis of I/O activity over the previous week.

- The
Database I/Ograph plots the number of blocks found in cached memory and the number of blocks read from disk over the previous week. The vertical key on the left side of the graph indicates number of blocks hit. - The
Row Activitygraph displays the row activity for tables residing within the database over the previous week.
The vertical key on the left side of the graph indicates the number of rows.
- The
Commits/Rollbacksgraph displays the number of transactions committed and rolled back within the selected database over the previous week.
The vertical key on the left side of the graph indicates the transaction count.

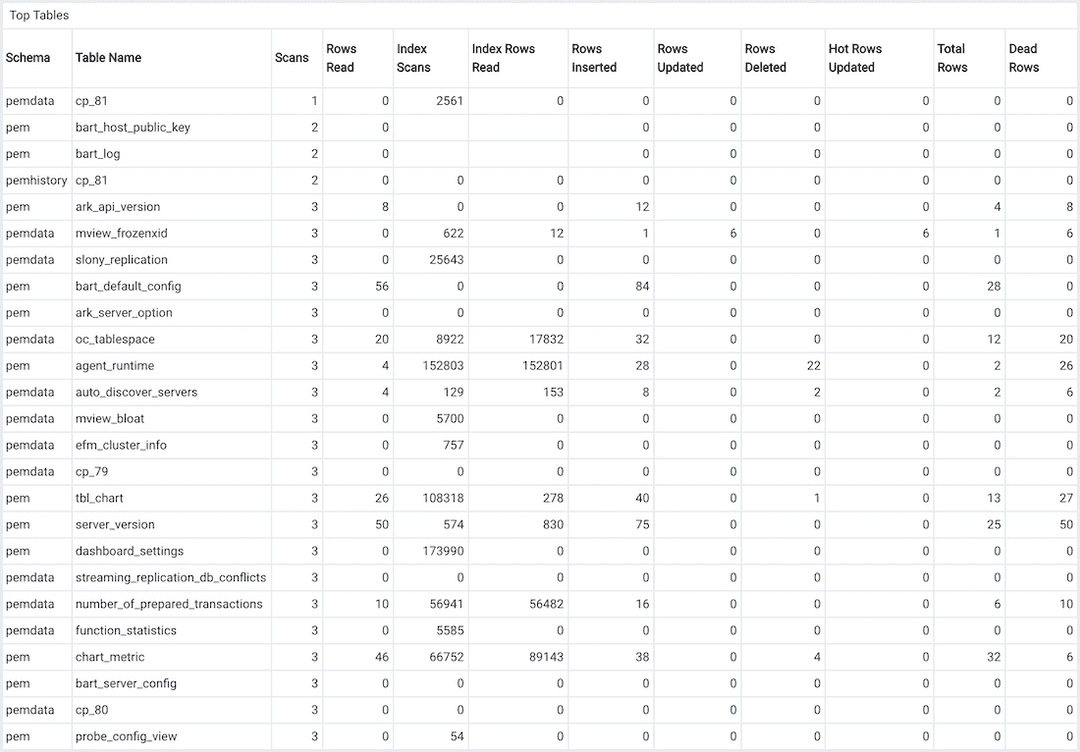
The Hot Tables table provides a detailed analysis of the activity for each table that resides within the selected database. Click a column heading to sort the table by the values within the column; click again to reverse the sort order.
- The
Schemacolumn identifies the schema in which the table resides. - The
Table Namecolumn identifies the name of the table. - The
Scanscolumn displays the number of scans performed on the table. - The
Rows Readcolumn displays the number of rows read from the specified table. - The
Index Scanscolumn displays the number of index scans performed on the specified table. - The
Index Rows Readcolumn displays the number of rows read during index scans on the specified table. - The
Rows Insertedcolumn displays the number of rows inserted into the specified table. - The
Rows Updatedcolumn displays the number of rows updated in the specified table. - The
Rows Deletedcolumn displays the number of rows deleted from the specified table. - The
Hot Rows Updatedcolumn displays the number of hot row updates into the table; when a hot row update occurs, the new row occupies the same page as the previous row. - The
Total Rowscolumn displays the number of total rows in the table. - The
Dead Rowscolumn displays the number of rows that have been deleted, but have not been reclaimed via a VACUUM command or the AUTOVACUUM process.