The Memory Analysis Dashboard v8
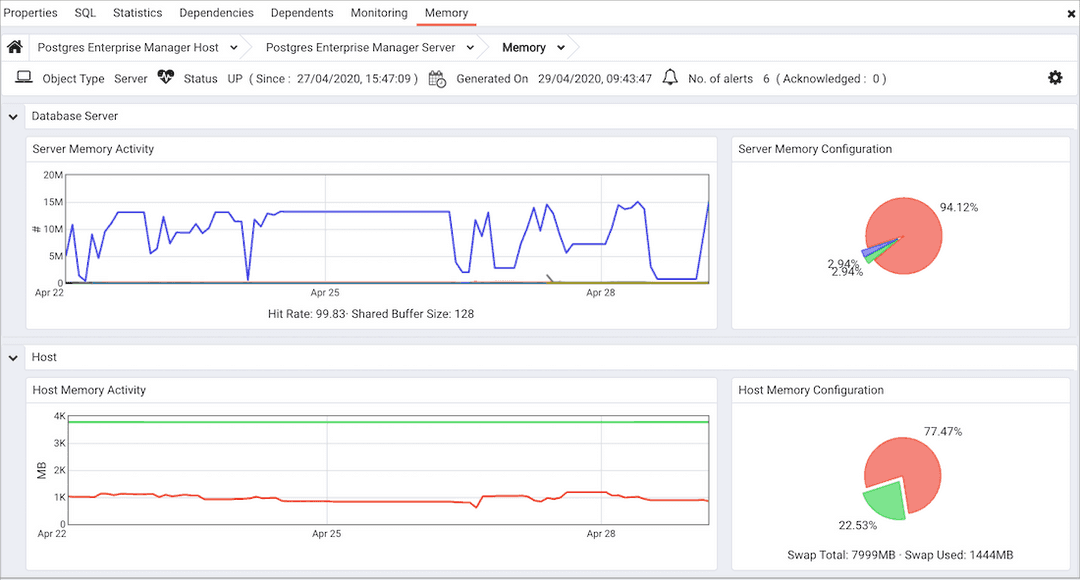
The Memory Analysis dashboard provides an overview of the memory usage for the selected server and server host for the previous week:

Use parameters on the PEM Server Configurations dialog to specify the auto-refresh rate for the dashboard. To access the Server Configuration dialog, select Server Configuration... from the PEM web interface Management menu.
The Memory Analysis dashboard header displays the date and time that the server was started, the date and time that the dashboard was last updated and the number of current alerts for objects monitored by the PEM server.
The Database Server section displays memory usage trends for the selected server.
- The
Server Memory Activitygraph displays the previous week's activity on the server; theLegendat the bottom of the graph provide a key to the colors used to chart information for each database. A vertical key on the left side of the graph indicates the actual block count for each value. - The
Server Memory Configurationpie chart displays the current memory usage (in megabytes).
The Host section displays the free and used memory on the host system:
- The
Host Memory Activitychart plots the free and used memory on the host system over the last week. - Sections of the
Host Memory Configurationpie chart represent the free and available memory on the host system when the last probe executed.