The Server Analysis Dashboard v8
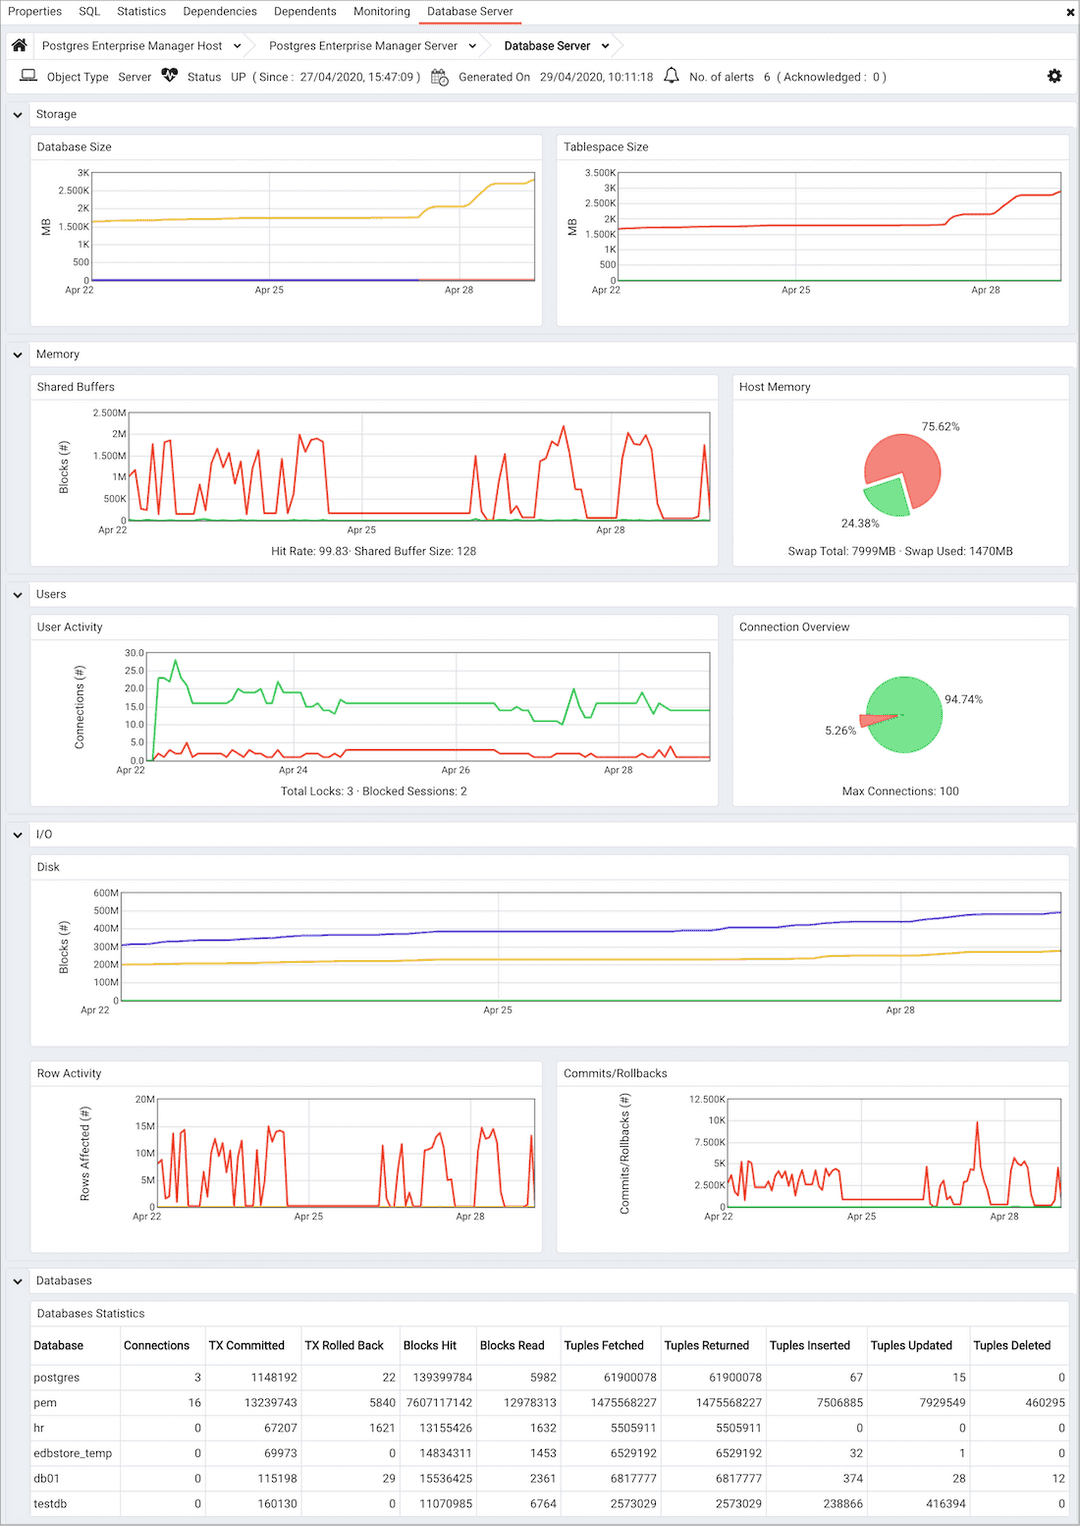
The Server Analysis dashboard provides a graphical analysis of a monitored server's usage statistics.

The Server Analysis dashboard header displays the date and time that the server was started, the date and time that the display was last updated, and the number of current alerts for items monitored by the PEM server.
Use parameters on the PEM Server Configurations dialog to specify the auto-refresh rate for the dashboard. To access the Server Configuration dialog, select Server Configuration... from the PEM web interface Management menu.
Graphs within the Storage section of the dashboard provide an analysis of the space consumed by databases and tablespaces on the server:
- The
Database Sizegraph displays the size (in Megabytes) of the 5 largest databases that reside on the PEM server. TheLegendat the bottom of the graph associates each database name with a color in the graph. - The
Tablespace Sizegraph displays the size (in Megabytes) of the 5 largest tablespaces that reside on the PEM server. TheLegendat the bottom of the graph associates each tablespace name with a color in the graph.
The Memory section of the dashboard provides an overview of the efficiency of the buffer cache over the previous week, and an analysis of the current swap memory usage:
- The
Shared Bufferschart compares the number of data blocks found in the shared memory cache with the number of blocks read from disk. A high hit-to-miss ratio indicates an efficiently configured memory cache. - The
Host Memorypie chart displays the current swap memory usage.
The Users section of the Server Analysis dashboard provides an overview of the user activity on the server:
- The
User Activitychart displays connection statistics gathered over the last week. TheLegendat the bottom of the chart provides a key to the data displayed. - The
Connection Overviewpie chart compares the currently active connections to the currently idle connections.
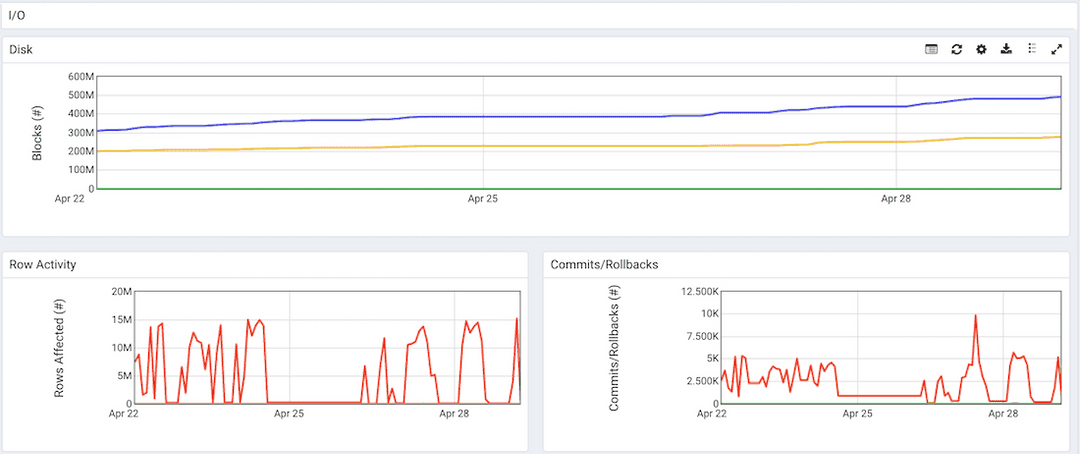
The I/O section of the Server Analysis dashboard provides an overview of the transactions processed by the server over the last week:

- The
Diskchart displays the number of 8KB blocks read from disk, and the number of 8KB blocks written to disk over the last week. - The
Row Activitychart plots row activity on tables stored on the server over the past week. TheLegendat the bottom of the chart provides a key to the data displayed. - The
Commits/Rollbackschart displays the number of transactions committed and rolled back on the selected server within the last week. A vertical count on the left side of the graph indicates the aborted transaction count, while theLegendat the bottom of the chart provides a key to the commits and rollbacks charted.
The Database Analysis table displays a list of the monitored databases that reside on the server, and the statistics gathered for each database over the last week. Click a column heading to sort the table by the data displayed in the column; click again to reverse the sort order.

- The
Databasecolumn displays the database name. - The
Connectionscolumn displays the number of current connections to the database. - The
TX Committedcolumn displays the number of transactions committed to the database within the last week. - The
TX Rolled Backcolumn displays the number of transactions rolled back within the last week. - The
Blocks Hitcolumn displays the number of blocks hit in the cache (in megabytes) within the last week. - The
Blocks Readcolumn displays the number of blocks read from memory (in megabytes) within the last week. - The
Tuples Fetchedcolumn displays the number of tuples fetched within the last week. - The
Tuples Returnedcolumn displays the number of tuples returned within the last week. - The
Tuples Insertedcolumn displays the number of tuples inserted into the database within the last week. - The
Tuples Updatedcolumn displays the number of tuples updated in the database within the last week. - The
Tuples Deletedcolumn displays the number of tuples deleted from the database within the last week.