The Server Log Analysis Dashboard v8
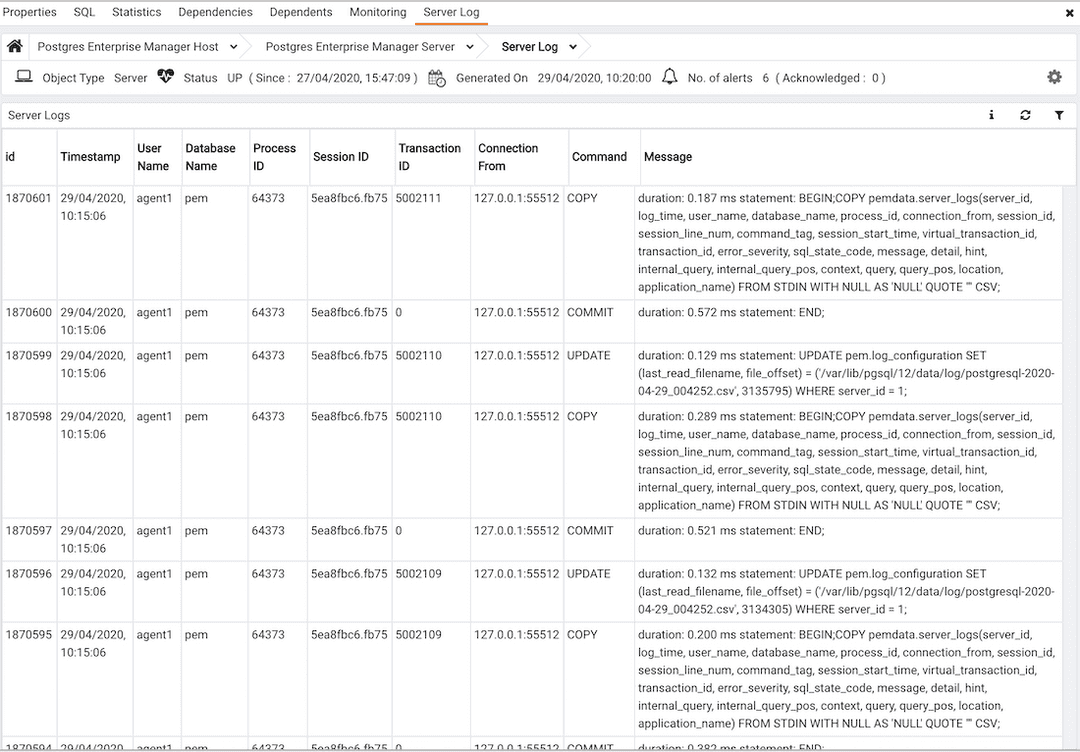
The Server Log Analysis dashboard displays the log files for the selected server. To view the Server Log Analysis dashboard, right-click on the name of a monitored server in the PEM client tree control, and navigate through the Dashboards menu, selecting Server Log Analysis.

The header information on the Server Log Analysis dashboard displays the date and time that the server was started, the date and time that the page was last updated, and the current number of triggered alerts.
The Server Log table displays the contents of the log files that are stored on the PEM server. For content to displayed, you must check the box next to Import logs to PEM when using Log Manager to configure logging for the server.
Entries are displayed in chronological order, most-recent log entries first. Use the scroll bars to navigate through the log entries, or to view columns that are off of the display.
Headings at the top of the server log table identify the information stored in each column:
- The
Idcolumn identifies the PEM agent that monitors the server that initiated the recorded transaction. - The
Servercolumn identifies the server that initiated the recorded transaction. - The
Timestampcolumn displays the date and time that the log entry was made. - The
User Namecolumn displays the name of the user that executed the recorded transaction. - The
Database Namecolumn displays the name of the database on which the recorded transaction was executed. - The
Process IDcolumn displays the identifier of the process that executed the recorded transaction. - The
Session IDcolumn displays the identifier of the session in which the transaction was executed. - The
Transaction IDcolumn displays the transaction identifier. - The
Connection Fromcolumn displays the host name or IP address from which the client session connected. - The
Commandcolumn displays the type of command executed. - The
Messagecolumn displays the transaction message.
Click Show Filters to display a panel that you can use to filter the audit log entries that are shown in the table below; click on Hide Filters to close the panel.

Use the fields within the filter definition box to describe a selection criteria that PEM will use to select a subset of a report for display:
- Use the date and time selectors in the
Fromfield to specify a starting date and time for the displayed log entries. - Use the date and time selectors in the
Tofield to specify an ending date and time for the displayed log entries. - Enter a username in the
Usernamefield to show log entries for the specified user only. - Enter a database name in the
Databasefield to show log entries for the specified database only. - Enter a command type (for example; 'SELECT', 'authentication' or 'idle') in the
Command typefield to show log entries of that type only.mmands that will be displayed in the filtered report.
When you've described the criteria by which you wish to filter the audit logs, click Filter to display the filtered server log in the lower portion of the Server Log Analysis dashboard. Click the Hide Filters label to close the filter definition box.