Using SQL Profiler v8
You can use SQL Profiler to create and store up to 15 named traces; use menu options to create and manage traces.
Creating a Trace
You can use the Create trace... dialog to define a SQL Trace for any database on which SQL Profiler has been installed and configured. installed and configured. To access the dialog, highlight the name of the database in the PEM client tree control; navigate through the Management menu to the SQL Profiler pull-aside menu, and select Create trace....
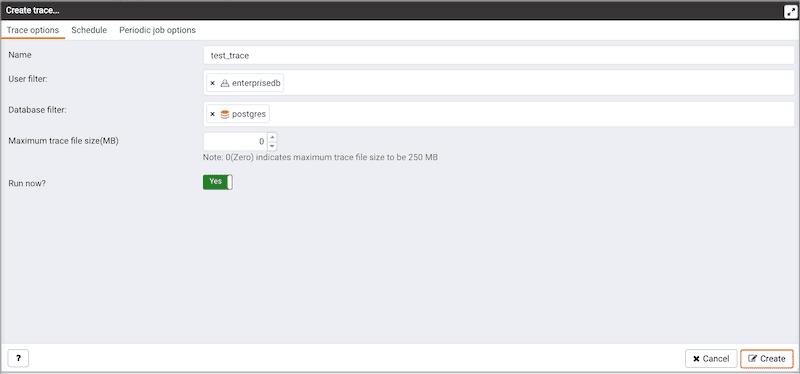
Use the fields on the Trace options tab to specify details about the new trace:
- Provide a name for the trace in the
Namefield. - Click in the
User filterfield to specify the roles whose queries will be included the trace; optionally, check the box next toSelect Allto include queries from all roles. - Click in the
Database filterfield to specify which databases to trace; optionally, check the box next toSelect Allto include queries against all databases. - Specify a trace size in the
Maximum Trace File Sizefield; SQL Profiler will terminate the trace when it reaches approximately the size specified. - Specify
Yesin theRun Nowfield to start the trace when you select theCreatebutton; selectNoto enable fields on theScheduletab.
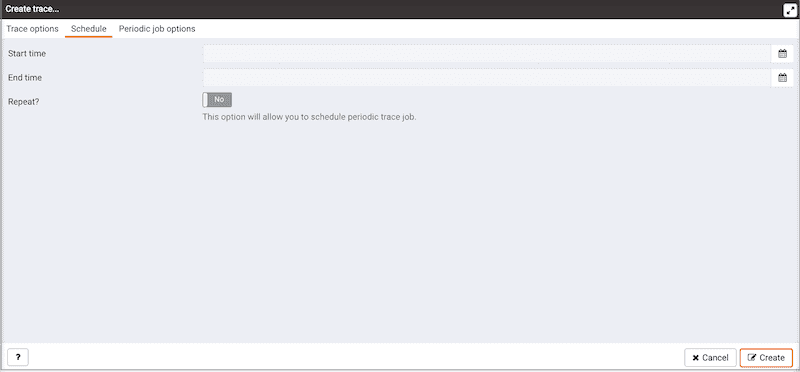
Use the fields on the Schedule tab to specify scheduling details for the new trace:
- Use the
Start timefield to specify the starting time for the trace. - Use the
End timefield to specify the ending time for the trace. - Specify
Yesin theRepeat?field to indicate that the trace should be repeated every day at the times specified; selectNoto enable fields on thePeriodic job optionstab.
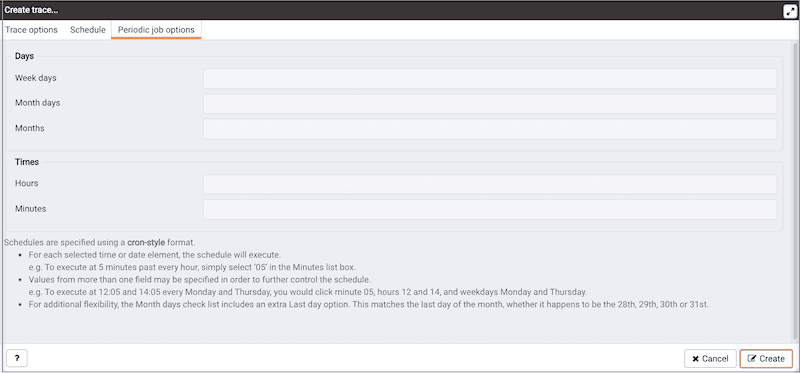
Fields on the Periodic job options tab specify scheduing details for a recurring trace. Use fields in the Days section to specify the days on which the job will execute:
- Click in the
Week daysfield to select the days of the week on which the trace will execute. - Click in the
Month daysfield to select the days of the month on which the trace will execute. - Click in the
Monthsfield to select the months in which the trace will execute.
Use fields in the Times section to specify a time schedule for the trace execution:
- Click in the
Hoursfield to select the hours at which the trace will execute. - Click in the
Minutesfield to select the hours at which the trace will execute.
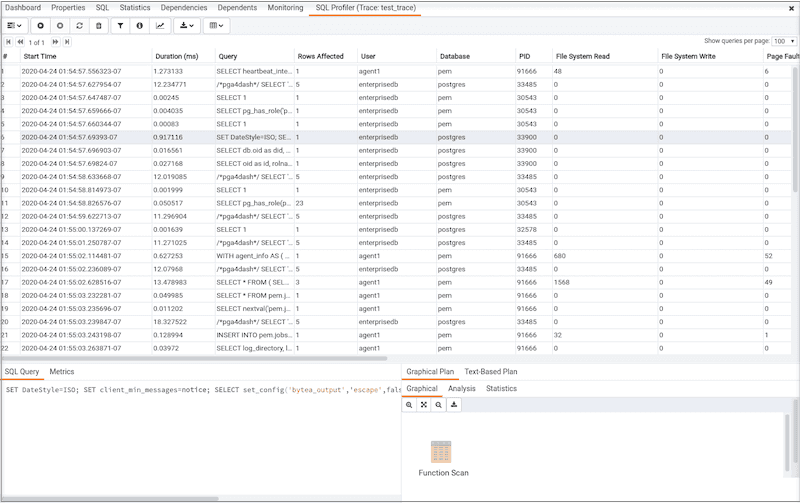
When you've completed the Create trace... dialog, click Create to start the newly defined trace or to schedule the trace for a later time. If you elect to execute the trace immediately, the trace results will display in the PEM client.
Opening a Trace
To view a previous trace, highlight the name of the profiled database in the PEM client tree control; navigate through the Management menu to the SQL Profiler pull-aside menu, and select Open trace.... You can also use the SQL Profiler toolbar menu to open a trace; select the Open trace... option. The Open trace... dialog opens.
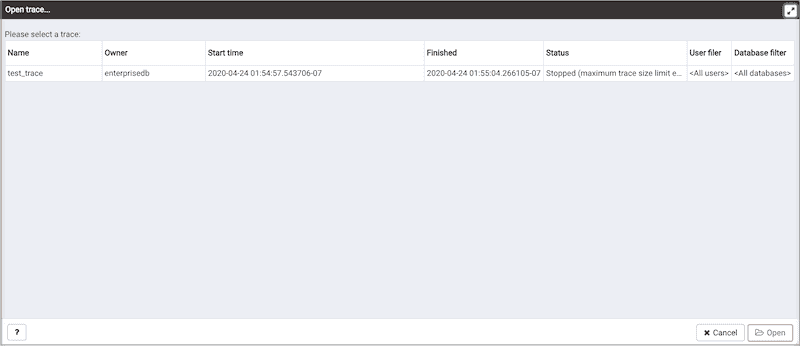
Highlight an entry in the trace list and click Open to open the selected trace. The selected trace opens in the SQL Profiler tab.
Filtering a Trace
A filter is a named set of (one or more) rules, each of which can hide events from the trace view. When you apply a filter to a trace, the hidden events are not removed from the trace, but are merely excluded from the display. Click the Filter icon to open the Trace Filter dialog and create a rule (or set of rules) that define a filter. Each rule will screen the events within the current trace based on the identity of the role that invoked the event, or the query type invoked during the event.
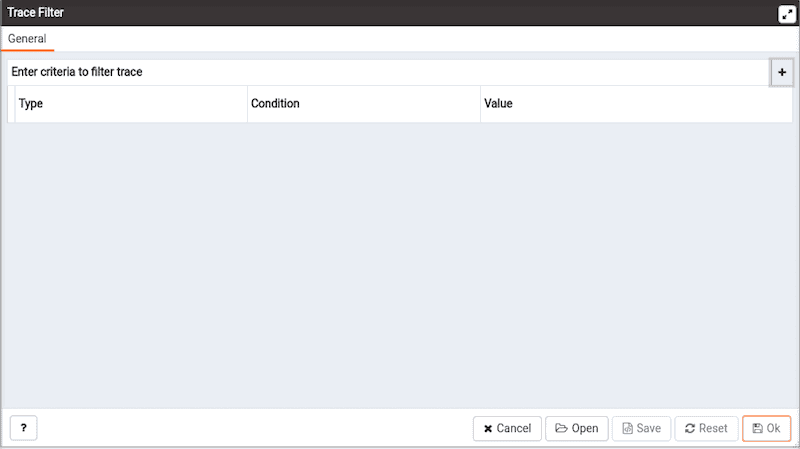
To open an existing filter, select theOpen button; to define a new filter, click the Add (+) button to add a row to the table displayed on the General tab and provide rule details:
- Use the
Typedrop-down listbox to specify the trace field that the filter rule will apply to. - Use the
Conditiondrop-down listbox to specify the type of operator that SQL Profiler will apply to the Value when it filters the trace:
- Select
Matchesto filter events that contain the specified Value.- Select
Does not matchto filter events that do not contain the specified Value.- Select
Is equal toto filter events that contain an exact match to the string specified in the Value field.- Select
Is not equal toto filter events that do not contain an exact match to the string specified in the Value field.- Select
Starts withto filter events that begin with the string specified in the Value field.- Select
Does not start withto filter events that do not begin with the string specified in the Value field.- Select
Less thanto filter events that have a numeric value less than the number specified in the Value field.- Select
Greater thanto filter events that have a numeric value greater than the number specified in the Value field.- Select
Less than or equal toto filter events that have a numeric value less than or equal to the number specified in the Value field.- Select
Greater than or equal toto filter events that have a numeric value greater than or equal to the number specified in the Value field.
- Use the
Valuefield to specify the string, number or regular expression that SQL Profiler will search for.
When you've finished defining a rule, click the Add (+) button to add another rule to the filter. To delete a rule from a filter, highlight the rule and click the Delete icon.
Click the Save button to save the filter definition to a file without applying the filter; to apply the filter, click OK. Select Cancel to exit the Trace Filter dialog and discard any changes to the filter.
Deleting a Trace
To delete a trace, highlight the name of the profiled database in the PEM client tree control; navigate through the Management menu to the SQL Profiler pull-aside menu, and select Delete trace(s).... You can also use the SQL Profiler toolbar menu to delete a trace; select the Delete trace(s)... option. The Delete traces... dialog opens.
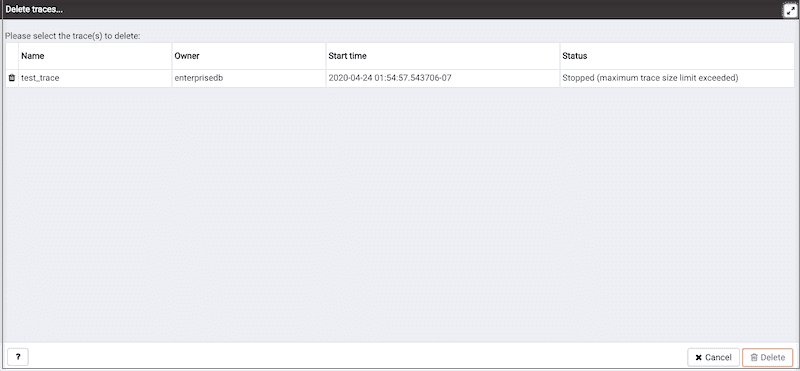
Click the icon to the left of a trace name to mark one or more traces for deletion and click Delete.

The PEM client will acknowledge that the selected traces have been deleted.
Viewing Scheduled Traces
To view a list of scheduled traces, highlight the name of the profiled database in the PEM client tree control; navigate through the Management menu to the SQL Profiler pull-aside menu, and select Scheduled traces.... You can also use the SQL Profiler toolbar menu to the list; select the Scheduled traces... option. The Scheduled traces... dialog opens.
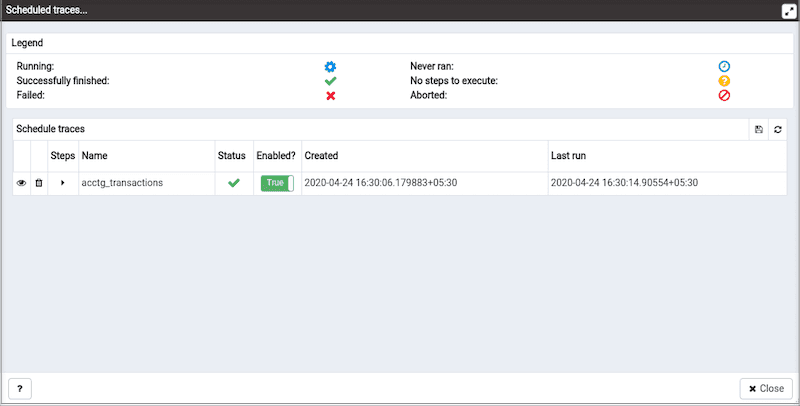
The Scheduled traces... dialog displays a list of the traces that are awaiting execution. Click the edit button to the left of a trace name to access detailed information about the trace:
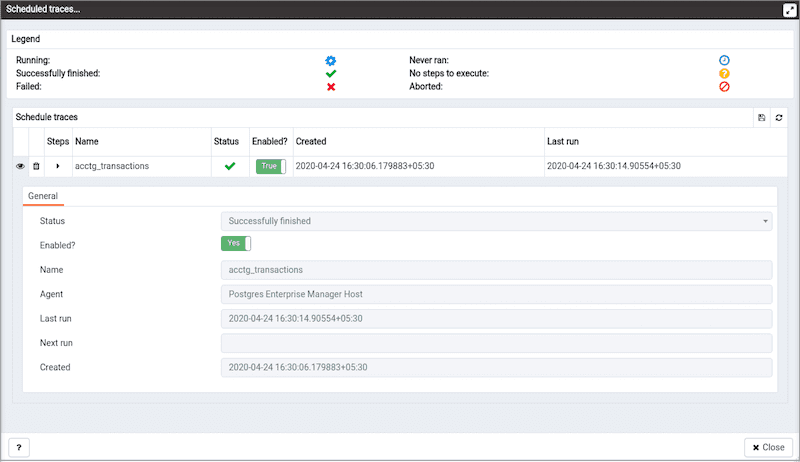
The General tab displays detailed information about the scheduled trace:
- The
Statusfield lists the status of the current trace. - The
Enabled?switch displaysYesif the trace is enabled;Noif the trace is disabled. - The
Namefield displays the name of the trace. - The
Agentfield displays the name of the agent responsible for executing the trace. - The
Last runfield displays the date and time of the last execution of the trace. - The
Next runfield displays the date and time of the next scheduled execution of the trace. - The
Createdfield displays the date and time that the trace was defined.