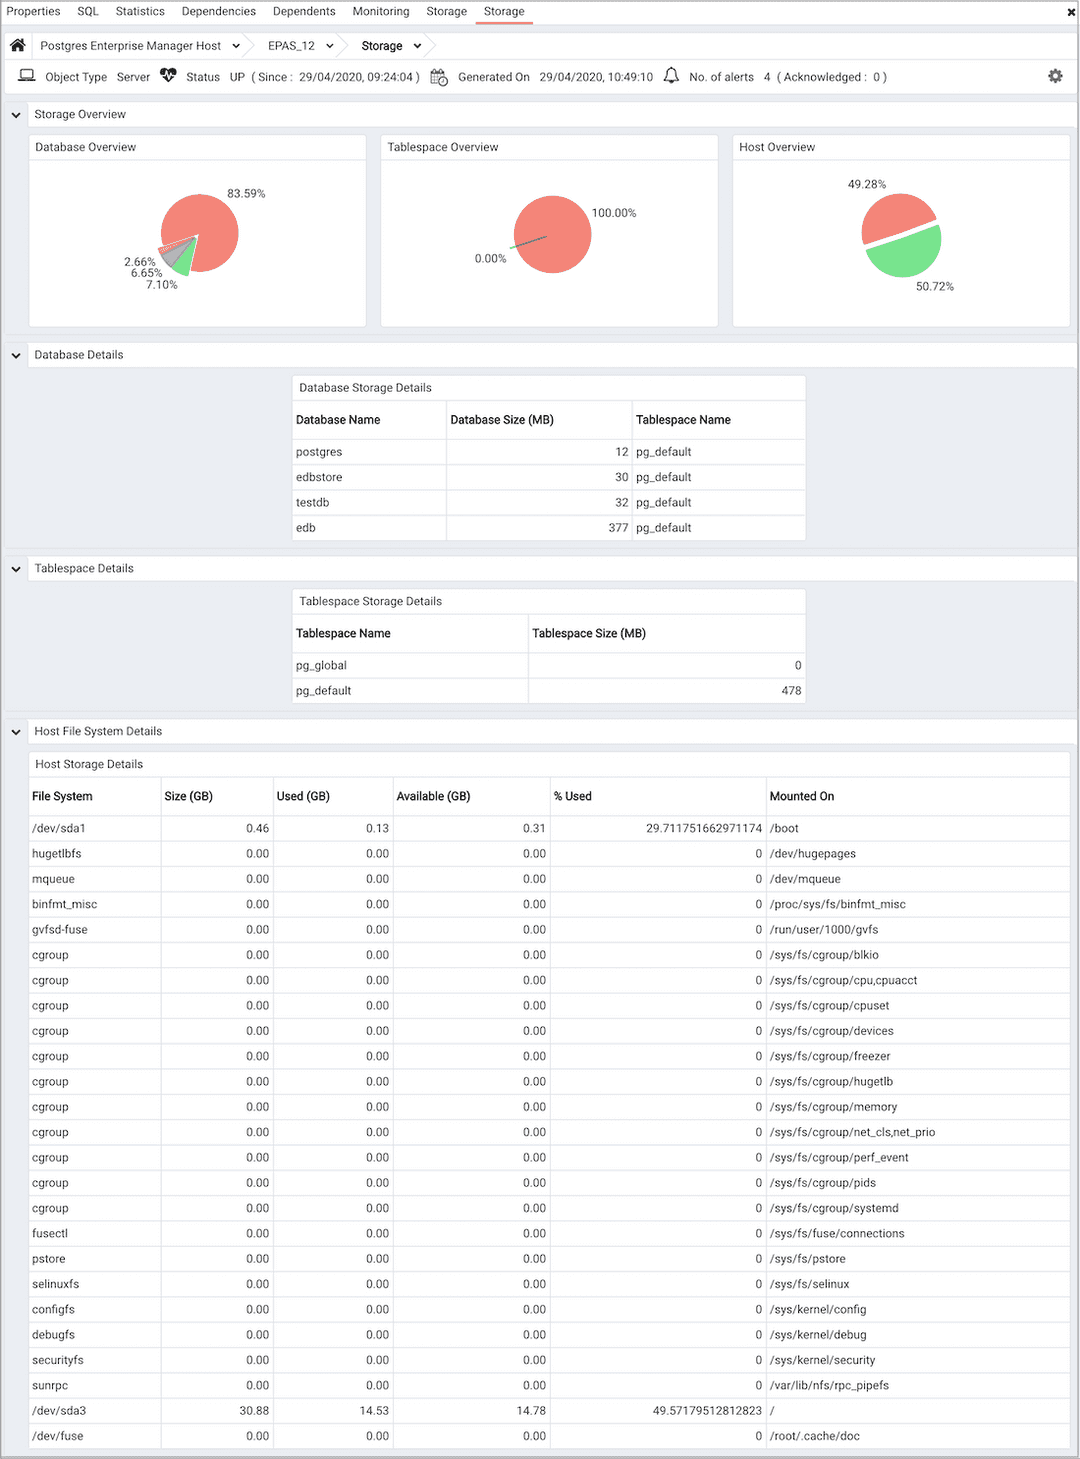
The Storage Analysis Dashboard v8
The Storage Analysis dashboard provides information about the size of objects stored on the server and about available storage space on the server.

Use parameters on the PEM Server Configurations dialog to specify the auto-refresh rate for the dashboard. To access the Server Configuration dialog, select Server Configuration... from the PEM web interface Management menu.
The Storage Analysis dashboard header displays the date and time that the PEM server started, the date and time that the dashboard was most recently updated, and the number of triggered alerts on objects monitored by the PEM server.
The Storage Overview section displays information about the size of databases, tablespaces and the host:
- The
Database Overviewpie chart shows the relative size of monitored databases stored on the server. The key (located below the chart) matches the database name to the respective color on the chart. - The
Tablespace Overviewpie chart shows the relative size of tablespaces on the server. The key (located below the chart) matches the tablespace name to the respective color on the chart. - The
Host Overviewpie chart represents the amount of used and free storage space on the server as of the last probe execution.
The Database Details table displays the size of each database stored on the server. Click a column heading to sort the table by the specified column; click again to reverse the sort order.
- The
Database Namecolumn displays the name of the database. - The
Database Size (MB)column displays the size of the database in megabytes. - The
Tablespace Namecolumn displays the name of the default tablespace assigned to the database.
The Tablespace Details table lists the name and size (in megabytes) of each tablespace defined for the server. Click a column heading to sort the table by the specified column; click again to reverse the sort order.
The Host File System Details table displays information about the file systems that reside on the system that hosts the PEM server:
- The
File Systemcolumn displays the name of the file system. - The
Size (GB)column displays the size of the file system in megabytes. - The
Used (GB)column displays the amount of the file system that is currently storing information. - The
Available (GB)column displays the amount of space available on the file system. - The
% Usedcolumn displays the percentage of the total storage space in use. - The
Mounted Oncolumn displays the directory on which the file system is mounted.