The Streaming Replication Analysis Dashboard v8
The Streaming Replication Analysis Dashboard displays statistical information about WAL activity for a monitored server. By default, replication probes are disabled; to view the Streaming Replication Analysis dashboard, you must enable probes on the primary and replica nodes. To enable the probes on the primary node, highlight the name of the primary server in the PEM client Browser tree control, and select Manage Probes... from the Management menu. Use the Manage Probes tab to enable the following probes:
- Streaming Replication
- WAL Archive Status
To enable the probes on the replica node, highlight the name of the replica server in the PEM client Browser tree control, and select Manage Probes... from the Management menu. Use the Manage Probes tab to enable the following probe:
- Streaming Replication Lag Time
Then, to open the Streaming Replication Analysis dashboard, navigate to the Monitoring tab, and:
- Select the name of the agent that monitors the node from the
Agentsdrop-down menu. - Select the name of the monitored server from the
Serversdrop-down menu. - Select
Streaming Replication Analysisfrom theDashboardsdrop-down menu.
The Streaming Replication Analysis dashboard header includes the date and time that the server was last started, the date and time that the page was last updated, and a current count of triggered alerts.
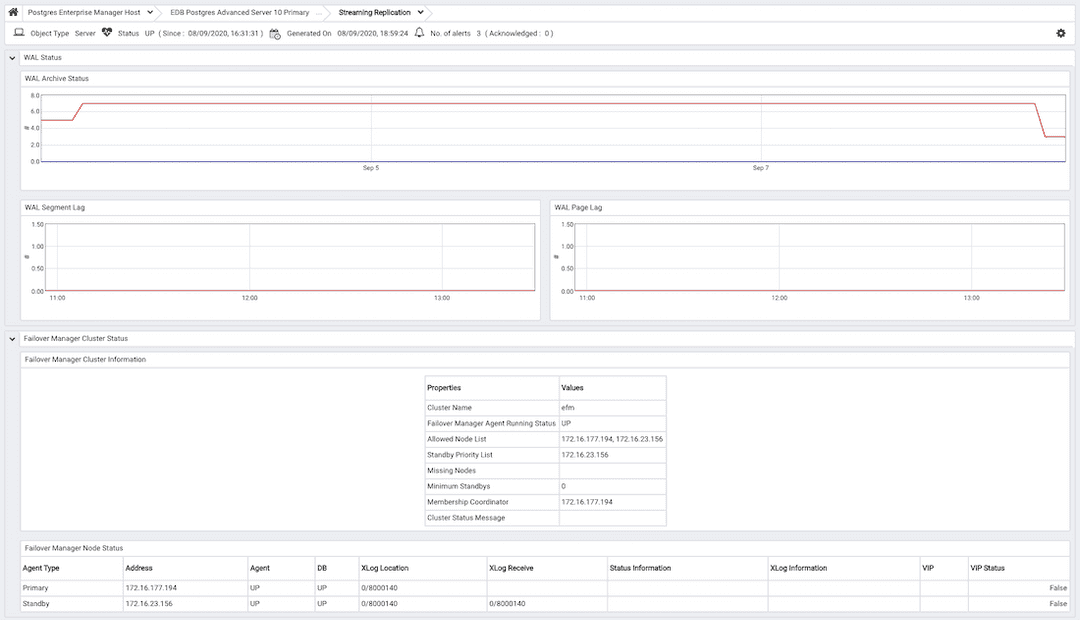
When accessing the Streaming Replication Analysis dashboard for the primary node of a replication scenario, the dashboard displays information about the write-ahead log activity for the server.

The WAL Archive Status graph displays WAL activity; the vertical key on the left side of the graph indicates the archive count; times are displayed across the bottom of the graph.
The WAL Segment Lag graph displays the segment lag for the replica nodes that are associated with the selected server. The vertical key on the left side of the graph indicates the archive count. Each node is displayed in a different color on the graph. The Legend provides a key to the identity (hostname and port) of each graphed replica node.
The WAL Page Lag graph displays the page lag activity for each replica node associated with the selected server. The vertical key on the left side of the graph indicates the page count. Each node is displayed in a different color on the graph. The Legend provides a key to the identity (hostname and port) of each graphed replica node.
Monitoring a Replica Node
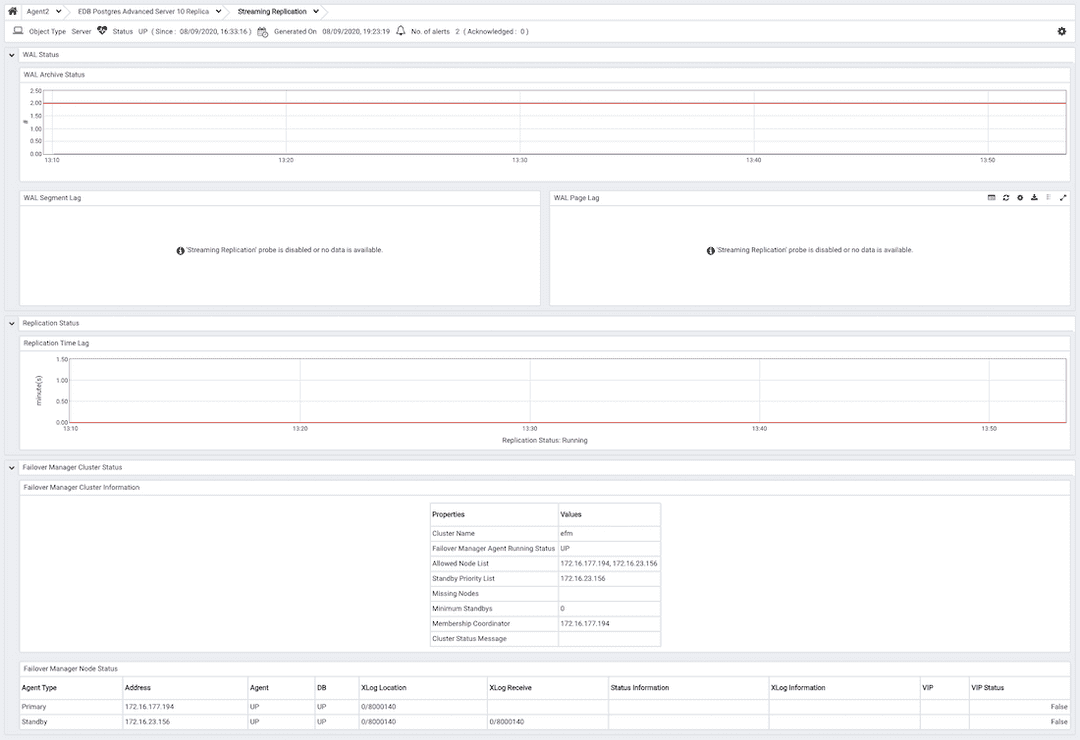
When accessing the Streaming Replication Analysis dashboard for the replica node of a replication scenario, the dashboard displays information about the write-ahead log activity for the server.

The WAL Archive Status graph displays WAL activity; the vertical key on the left side of the graph indicates the archive count; times are displayed across the bottom of the graph.
The WAL Segment Lag graph displays the segment lag for the replica nodes that are associated with the selected server. The vertical key on the left side of the graph indicates the archive count. Each replica node is displayed in a different color on the graph. The Legend provides a key to the identity (hostname and port) of each graphed slave node.
The WAL Page Lag graph displays the page lag activity for each replica node associated with the selected server. The vertical key on the left side of the graph indicates the page count. Each node is displayed in a different color on the graph. The Legend provides a key to the identity (hostname and port) of each graphed slave node.
The Replication Time Lag graph displays the delay between the time that an operation is performed on the primary node of the replication scenario and the time that the operation is written to the replica node. The vertical key on the left side of the graph indicates the replication delay in minutes. Hover your mouse over a point on the graph to display the date and time that corresponds to that coordinate.
A label at the bottom of the dashboard confirms the status of the replication replica.
Monitoring a Failover Manager Cluster
If you have configured PEM to monitor a Failover Manager cluster, the Streaming Replication Analysis dashboard will display tables that provide an overview of the clusters status and configuration, and information about each cluster member. To display cluster information on the Streaming Replication dashboard, you must provide the following information on the Advanced tab of the server Properties dialog for each node of the cluster:
- Use the
EFM Cluster Namefield to specify the name of the Failover Manager cluster. The cluster name is the prefix of the name of the cluster properties file. For example, if your cluster properties file is namedefm.properties, your cluster name isefm. - Use the
EFM Installation Pathfield to specify the location of the Failover Manager binary file. By default, the Failover Manager binary file is installed in/usr/edb/efm-3.1/bin.
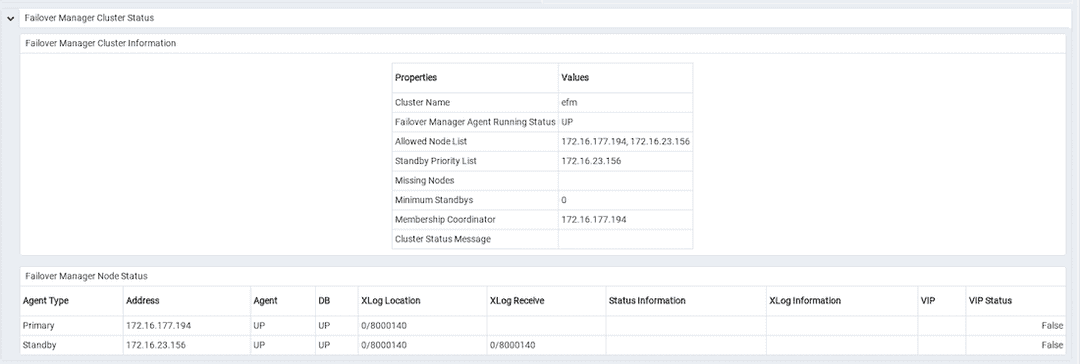
The Failover Manager Cluster Status section of the Streaming Replication Analysis dashboard displays information about the monitored cluster:

The Failover Manager Cluster Information table provides information about the Failover Manager cluster:
- The
Propertiescolumn displays the name of the cluster property. - The
Valuescolumn displays the current value of the property.
The Failover Manager Node Status table displays information about each node of the Failover Manager cluster:
- The
Agent Typecolumn displays the type of agent that resides on the node; the possible values are Primary, Replica, Witness, Idle, and Promoting. - The
Addresscolumn displays the IP address of the node. - The
Agentcolumn displays the status of the agent that resides on the node. - The
DBcolumn displays the status of the database that resides on the node. - The
XLog Locationcolumn displays the transaction log location of the database. - The
Status Informationcolumn displays any error-related information about the node. - The
XLog Informationcolumn displays any error-related information about the transaction log. - The
VIPcolumn displays the VIP address that is associated with the node. - The
VIP Statuscolumn displaysTrueif the VIP is active for the node,Falseif the VIP is not.