Tab 1 (Metrics) v8
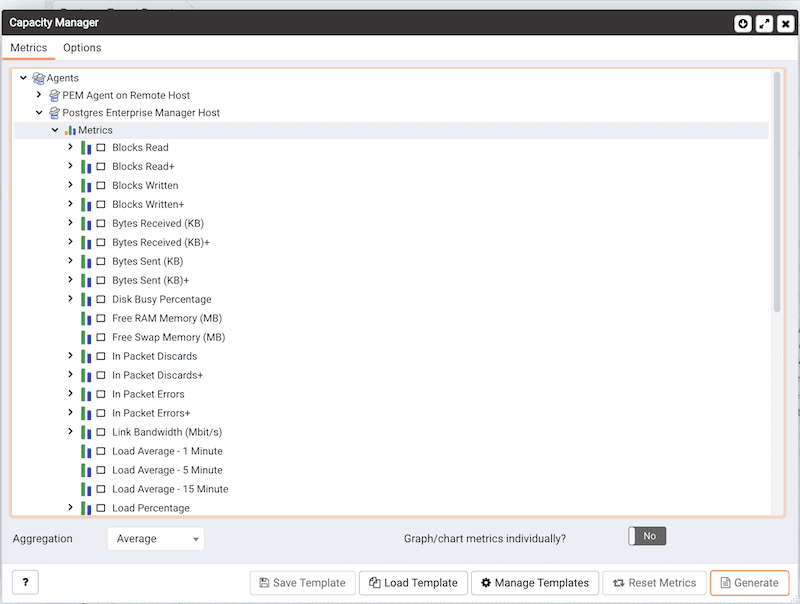
To create a Capacity Manager report, expand the tree control on the Metrics tab to locate the metrics that are available for the node that you wish to analyze.

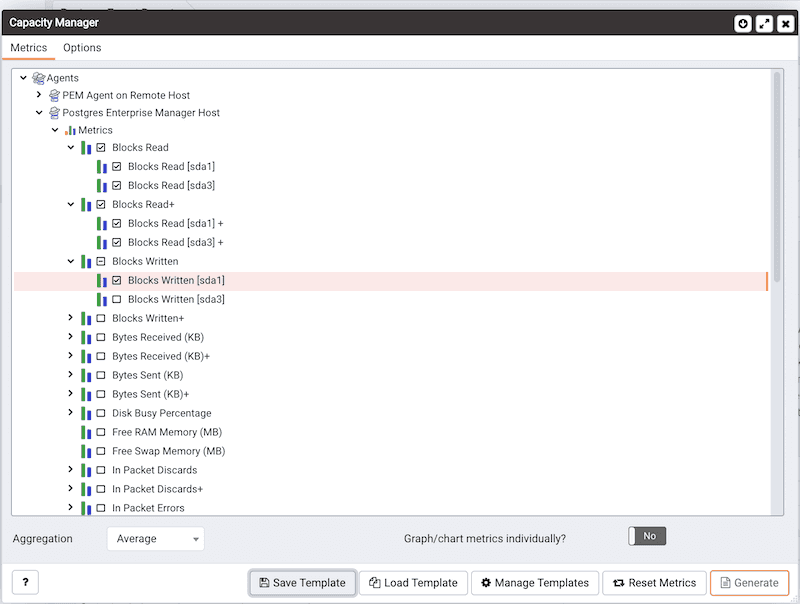
To include a metric in the Capacity Manager report, check the box to the left of the name of the metric on the Metrics tab.

Capacity Manager will use the aggregation method specified by the Aggregation drop-down listbox (located at the bottom of the Metrics tab). The aggregation method instructs Capacity Manager how to evaluate and plot the metric values. Select from:
- Average: Use the average of the values recorded during the time period.
- Maximum: Use the maximum value recorded during the time period.
- Minimum: Use the minimum value recorded during the time period.
- First: Use the first value recorded during the time period.
To remove a metric from the Capacity Manager report, uncheck the box to the left of the name of a metric.
Move the slider next to Graph/chart metrics individually? to Yes to instruct Capacity Manager to produce a separate report for each metric selected on the Metrics tab. If the option is set to No, all selected metrics will be merged into a single graph or table.
Click the Generate button to display the report onscreen (accepting the default configuration options), or continue to the Options tab to specify sampling boundaries, report type and report destination.