
This blog was co-authored by Martin Marques.
To successfully migrate applications from Oracle to PostgreSQL, organizations need to provide tools to the teams most impacted by these changes—DBAs, developers, and IT.
Today, EDB takes another significant step forward in further easing our customers’ migrations to open source database solutions, with the release of Postgres Workload Reports. In addition to offering familiarity to Oracle users by implementing the formatting of Automatic Workload Report (AWRs), Postgres Workload Reports advance database performance analysis and improves diagnosis and troubleshooting when issues occur.
The Postgres Workload Report feature is available today for PostgreSQL and EDB Postgres Advanced Server subscription customers.
Background
Oracle's AWR Reports are a standard, trusted performance monitoring and optimization tool in enterprise database environments, thanks to the detailed insights they provide into diagnosing and tuning database performance. For Oracle DBAs, the absence of a similar PostgreSQL tool can lead to a steep learning curve when migrating to Postgres.
Transition challenges can be even more acute in mixed database environments, where administrators oversee both Oracle and Postgres databases, because the specific format and depth of data in AWRs are not replicated in Postgres reporting.
The inability to summarize, view and share this information is not just a feature gap—it’s a significant barrier to diagnosing database performance in Postgres. These challenges impact DBA productivity in Postgres environments and, as a result, can lead to potential downtime of business applications.
How Postgres Workload Reports improve performance diagnostics across the business
In developing Postgres Workload Reports, EDB has bridged the gap between Oracle and PostgreSQL diagnostics quality by delivering a tool that mirrors the functionality and depth of Oracle's AWR but which is purpose-built for modern Postgres environments.
With Postgres Workload Reports, EDB is providing best-of-breed performance diagnostics for the Postgres ecosystem, with detailed metrics, easy-to-understand reports, and an AWR-like user interface to enhance organizational adoption.
Postgres Workload Reports equip DBAs with the necessary tools to ensure high performance Postgres, thereby supporting the uninterrupted operation of essential business applications.
Providing wait state information in Postres Workload Reports is a valuable feature for DBAs, with these reports also offering insight into top SQL statements and Postgres configuration information. As a result, Postgres Workload Reports allow DBAs and developers to easily understand and resolve the performance issues their database is experiencing by evaluating a single report in either Markdown, PDF, or HTML.
If required, Postgres Workload Reports can be sent to more experienced DBAs and experts for further analysis, enhancing organizational Postres diagnostics and troubleshooting buy-in.
What are you waiting for?
While Postgres Workload Reports offer many features, what is new and unique about them compared to many other Postgres performance tools is that they allow you to evaluate what queries were waiting for during a particular time window. These analyses are made possible by the edb_wait_states extension. For instance, consider this output from a PWR report run using HammerDB against a Postgres Server.
First, let’s look at the Server information section of the report:
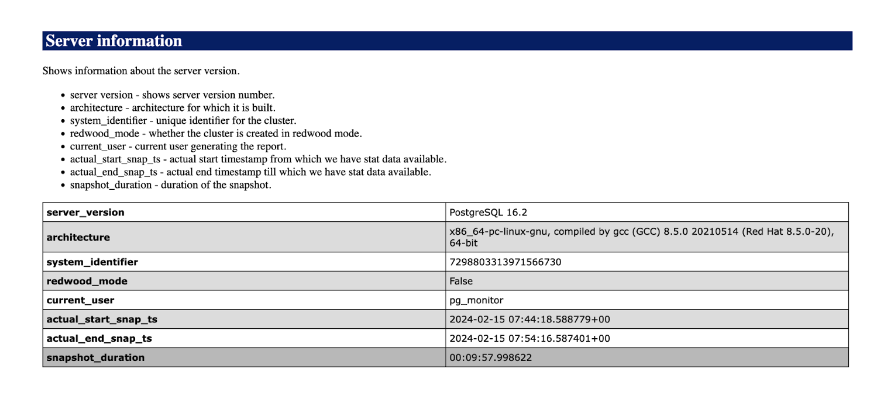
You can get some general information about the server right away. However, let's focus on two items: the actual_start_snap_ts (2024-02-15 07:44:18.588779+00) and the actual_end_snap_ts (2024-02-15 07:54:16.587401+00). You can see that we are evaluating the database for a period of 10 minutes. During this timeframe, we are also looking at the amount of dbtime. In this case, it was 184 seconds. This means that during this 10-minute snapshot, the database server was either executing queries or waiting for something so it could continue executing queries.
So, the questions that have perplexed many of our Postgres performance troubleshooting efforts are:
- Are we executing queries or waiting on locks, disk I/O, or CPU?
- If we are waiting on something, what is it?
This Postgres Workload Report helps us answer these two questions, as evidenced in this Top wait events report.
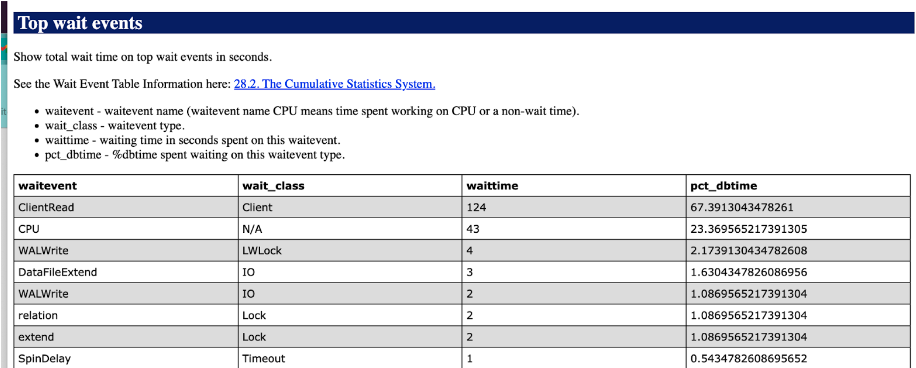
Of the 184 seconds evaluated, 124 seconds were spent waiting on ClientRead events. Referring to Section 28.2 of PostgreSQL documentation, this metric indicates that the system was waiting to read data from the client.
So what could this mean? Well, a variety of things, including:
- This server had a HammerDB benchmark running against it. One possibility—and in this case, the most probable conclusion—is that the client test machine was overwhelmed and could not respond to the server fast enough.
- The client was waiting for some user input, such as a return from a prompt.
What it clearly doesn’t mean is that something on the server is impacting the system’s throughput—instead, the issue is with the client.
In looking at Top SQL statements, you can see the following:
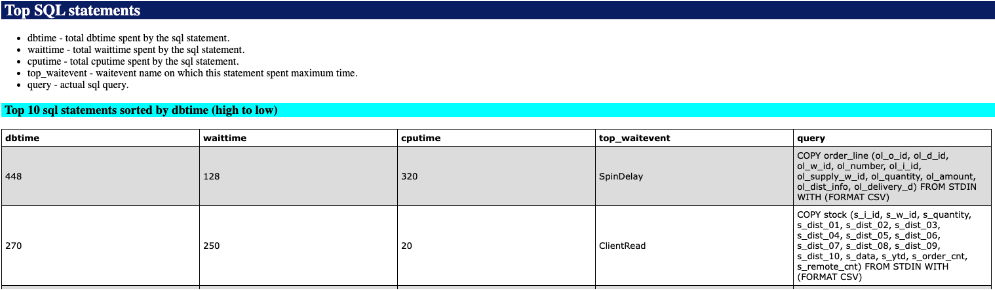
COPY order_line (ol_o_id, ol_d_id, ol_w_id, ol_number, ol_i_id, ol_supply_w_id, ol_quantity, ol_amount, ol_dist_info, ol_delivery_d) FROM STDIN WITH (FORMAT CSV)
This indicates that the bottleneck during this period involved reading a CSV file from STDIN on the client machine.
In the past, getting information about what the server is waiting on has proven extremely difficult. Postgres Workload Reports now makes it simple. You can evaluate wait events for any period you’d like and determine what issues the system may be facing.
Summary
The inability to summarize, view, and share information about top SQL events, wait events, and session activity has presented a significant barrier to diagnosing database performance in Postgres. This Postgres feature gap has adversely impacted DBA productivity and, as a result, could lead to downtime of business applications. Now, Postgres Workload Reports equip DBAs with the necessary tools for Postgres to ensure high performance, thereby supporting the uninterrupted operation of essential business applications.
Postgres Workload Reports help DBAs understand system behavior nuances like no other Postgres tool can. This level of detail is invaluable for diagnosing and resolving complex database performance issues. Postgres Workload Reports help customers avoid costly outages by proactively optimizing our Postgres databases with a deeper understanding of what is happening on our revenue-generating databases.
Relevant Blogs
Release Radar: EDB Enhances Oracle Compatibility with DBMS_Scheduler Extension in BigAnimal
EDB is committed to assuring seamless Oracle-to-Postgres transitions for customers, and we recently added support for DBMS_Scheduler extension in our fully managed BigAnimal Postgres cloud database service to enhance these...