Alerting is integral to the Hybrid Manager (HM) observability ecosystem, which proactively notifies about critical events that impact the performance of the Postgres cluster. It continuously monitors essential performance metrics and triggers alerts whenever predefined thresholds are exceeded. This robust alerting system integrates seamlessly into the HM ecosystem, leveraging real-time data collected from Postgres clusters and their infrastructure across all regions. Alerts are enabled by default for each project created in HM.
The alerting system ensures timely notifications through intuitive notifications, allowing for quick and informed actions. Comprehensive alert configuration options allow specific thresholds and intervals to be configured to customize the alerting experience. This seamless integration of monitoring and alerting offers complete visibility, enabling swift responses to potential issues and maintaining optimal cluster performance.
Viewing alerts
Estate-level alerts
To view active alerts across all clusters at a glance:
- In the HM console, select Estate.
- Select the Postgres tab.
- Locate the Active Alerts card to see a summary of alerts across all clusters.
Cluster-level alerts
You can access the alerts on the Monitoring tab of the cluster detail page and view the alert details for a specific cluster.
For HM clusters:
- In the HM console, select Projects.
- Select any project from the list.
- In the left navigation, select Clusters.
- Select any cluster with a ready state.
- On the cluster detail page, select the Monitoring tab.
For external HM clusters:
- In the HM console, select Estate.
- Go to the table listing all the clusters.
- Select a ready cluster with Management as self-managed.
- On the cluster detail page, select the Monitoring tab.
The Monitoring tab displays the Active Alerts list in a table. At the top of this tab, you can view a summary of the active alerts with their severity levels set to High, Medium, and Low.
You can search for specific alerts using the:
- Search box for query-based search
- Date range selector for a specific date range-based search
- Filter for a severity-level-based search
- Sort utility to sort the alerts list based on severity, alert start time, and alert name
- Refresh button to refresh the alerts list
- Column selector to select the columns to display in the table according to your preferences
- Download button to download the alerts list in CSV (comma-separated values) format
Select Refresh to manually refresh the alerts. The last refresh interval is displayed at the bottom of the alert table.
Select any nodes in the Node column to view the charts as they were when the alert was triggered. Selecting a node applies the filters in the Monitoring tab and displays the relevant charts.
Download CSV — You can download the alert details in CSV format using the Download button in the top-right corner. The CSV file includes these columns:
- Alert Description
- Start Time
- Alert Severity
- Metric Triggering the Alert
- Node where the alert occurred
- Alert Threshold
- Cluster ID
- Project ID
Configuring alerts
You can configure alerts at the project level. The project admins can configure the alerts. Once the alerts are configured and applied, the system requires a few minutes to fully process the alerts.
To configure alerts:
- At the top of the HM console, select Projects.
- Select any project from the list.
- In the left navigation, select Settings.
- Select Alerts to access/edit the alerts configuration.
For each alert, select the Edit button to:
- Enable/Disable — To activate or deactivate a specific alert as required.
- Notify After — To set the time duration before the alert is triggered.
- Threshold — To specify the percentage or values that will trigger an alert when they're exceeded.
The list of the alerts with the default configuration:
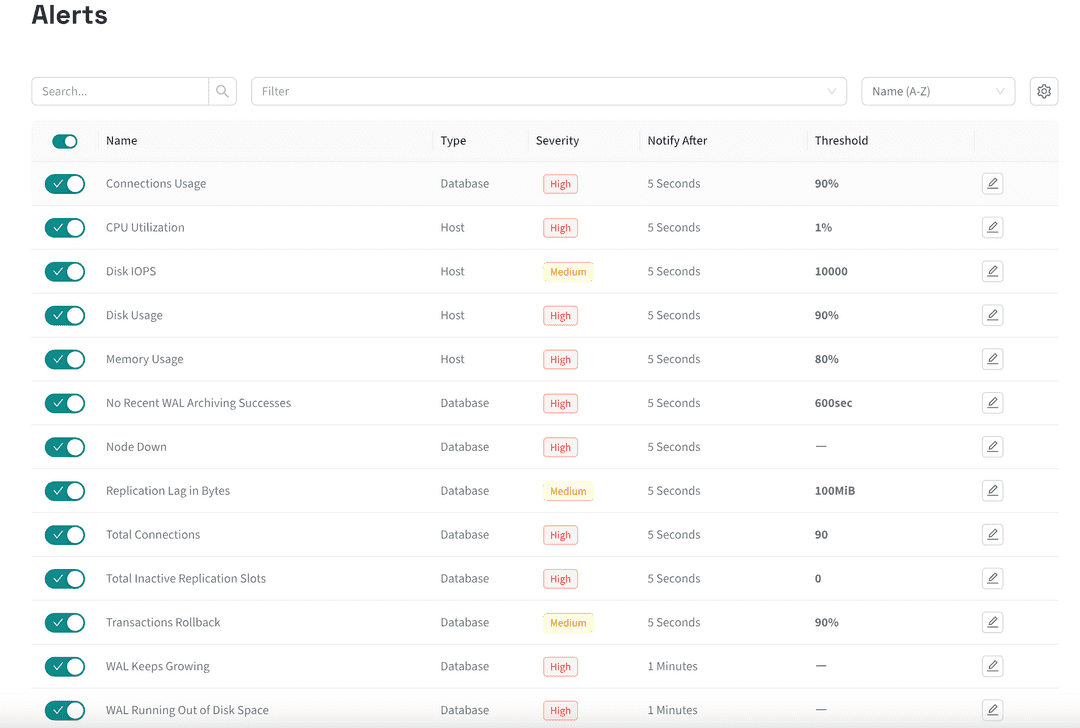
Database-level alerts
| Alert | Default severity | Threshold |
|---|---|---|
| Connections Usage | High | 90% |
| Transactions Rollback | High | 90% |
| Total Connections | High | 90 count (0–1000) |
| Replication Lag in Bytes | Medium | 1 MiB |
| Replicas Lagging Behind | Medium | 1 MiB |
| Total Inactive Replication Slots | High | 0 count (0–5) |
| No Recent WAL Archiving Successes | High | 600 seconds (60–600) |
| WAL Keeps Growing | High | Fixed |
| WAL Running Out of Disk Space | High | Fixed |
| Backup Failures | High | Fixed |
| Backup Time Since Last Success | Medium | 300 seconds |
| PG Data Disk Usage | High | 90% |
| WAL Disk Usage | High | 90% |
| Backup Longer Than Expected | High | 0 seconds |
| PG Buffer Cache Hit Percentage | Low | 0% |
| PG Error Restarts | Medium | 10 minutes |
| PG Long Running Transactions | Low | 300 seconds |
| PG Transaction Age | High | 100% |
| PG Multi-Transaction Age | High | 100% |
| PG Log Too Many Errors | Medium | 5 count |
| PG Log Critical Errors | High | 30 minutes |
| Node Down | Pending SME confirmation | Pending SME confirmation |
Fixed means the threshold is a fixed value and can't be modified.
Host-level alerts
| Alert | Default severity | Threshold |
|---|---|---|
| CPU Utilization | High | 90% |
| Disk IOPS | High | 10,000 count |
| Disk Usage | High | 90% |
| Memory Usage | High | 90% |
| OOM Killed PG Pod | High | 10 minutes |
Notes
- Any changes made to the alert configuration are saved automatically.
- All the alerts aren't available for external HM clusters due to technical limitations.
Platform alert rules
Beyond the console-level alerts configured per project, HM deploys a comprehensive set of Prometheus alert rules that monitor the entire platform stack. These rules are defined as PrometheusRule custom resources in the edb-observability namespace and are evaluated by Thanos Ruler.
HM ships a default set of platform alert rules grouped into the categories below, plus recording rules that precompute frequently used metrics.
| Category | Rule groups | Key monitors |
|---|---|---|
| Postgres | postgres, postgres_backup | Connections, WAL archiving, XID wraparound, backup failures |
| Infrastructure | infra | Certificates, Velero backups, OOM kills, node pressure, crash loops |
| Storage | pvc, kubernetes-storage | PVC capacity (90/95/99%), PV filling up, inode exhaustion |
| Kubernetes | kubernetes-apps, kubernetes-resources, kubernetes-system, kubernetes-system-apiserver, kubernetes-system-kubelet | Pod health, deployments, resource quotas, API server availability, kubelet, node readiness |
| Observability | prometheus, alertmanager.rules, prometheus-operator, loki_alerts | Prometheus/Alertmanager self-monitoring, Loki health |
| Node | node-exporter, node-network | Filesystem, CPU, memory, network, clock, RAID, systemd |
| Platform | upm, thanos, stats-collector-db, kube-state-metrics, config-reloaders, general.rules | Internal DB, beacon heartbeat, Thanos compactor |
Alert rule examples
The following examples show actual PromQL expressions from the deployed PrometheusRule resources.
Postgres connection saturation (PostgresNinetyPercentConnectionCount, severity: error, for: 15m) — Fires when a cluster reaches 90% of its configured max_connections:
sum by (hcp_instance, cluster) (cnp_backends_total)
  / avg by (hcp_instance, cluster) (
      cnp_pg_settings_setting{name="max_connections", cluster!=""}
    ) >= 0.9
Pod OOM killed (PodOOMKilled, severity: error, for: 10m) — Detects non-Postgres pods that were OOM killed and restarted within 10 minutes:
(kube_pod_container_status_restarts_total{
    pod!~"^p-[0-9a-z]{10}(?:-[a-z]{1,2}-[0-9]{1,2})?-[0-9]{1,2}$|p-.+-(rwp|rop|proxy).*"
  } - kube_pod_container_status_restarts_total offset 10m >= 1)
  and ignoring (reason)
    min_over_time(
      kube_pod_container_status_last_terminated_reason{reason="OOMKilled"}[10m]
    ) == 1
Node filesystem running low (NodeFilesystemAlmostOutOfSpace, severity: warning, for: 30m) — Fires when a filesystem drops below 5% available space (warning) or 3% (critical):
(
  node_filesystem_avail_bytes{job="node-exporter",fstype!="",mountpoint!=""}
    / node_filesystem_size_bytes{job="node-exporter",fstype!="",mountpoint!=""}
    * 100 < 5
  and
    node_filesystem_readonly{job="node-exporter",fstype!="",mountpoint!=""} == 0
)
CloudNativePG cluster not ready (CNPClusterNotReady, severity: warning, for: 1h) — Fires when a database cluster remains in a not-ready state for over 1 hour:
cnpg_cluster_status_condition{type="Ready"} == 0
Note
Alert severity is defined either as a Prometheus label or as an annotation, depending on the rule group. Infrastructure and Postgres rules use annotation-based severity, while Kubernetes and Prometheus self-monitoring rules use label-based severity.
Custom alert rules
Extend HM's built-in alerting with your own metric and log alert rules:
- Custom metric alerts use the
PrometheusRulecustom resource definition (CRD). Create aPrometheusRulein theedb-observabilitynamespace with the requiredapp: customlabel, and the Prometheus Operator automatically loads it. Thanos Ruler then evaluates the rule. - Custom log alerts use Loki alert rules deployed as a ConfigMap with the
loki_rule: "true"label in theedb-observabilitynamespace. Loki's Ruler component reads the ConfigMap and evaluates the LogQL expressions on the configured interval.
Both alert types feed into the same Alertmanager routing pipeline described in Alertmanager configuration, so any receiver you configure (PagerDuty, Slack, and email) handles built-in and custom alerts the same way.
[DOCS-4068-7]: # (SME-CONFIRM: "Alertmanager configuration (advanced)" below is from a partially-verified eng doc — confirm before merging.)
Advanced Alertmanager configuration
For advanced alert routing to external services, Alertmanager acts as a proxy for routing alerts generated by Prometheus, Thanos, and Loki to services like PagerDuty, Slack, and email.
By default, Alertmanager has no outbound route. Configure it by adding an AlertmanagerConfig custom resource to the edb-observability namespace with the label edb-alertmanager-config: hcp.
Each example below routes all alerts to a single receiver — adjust route and receivers to fit your own alerting strategy.
PagerDuty example
apiVersion: monitoring.coreos.com/v1alpha1
kind: AlertmanagerConfig
metadata:
  labels:
    edb-alertmanager-config: hcp
  name: pagerduty
  namespace: edb-observability
spec:
  route:
    receiver: Pagerduty
    groupBy: ["alertname", "cluster", "service"]
    groupWait: 30s
    groupInterval: 5m
    repeatInterval: 15m
    routes:
      - receiver: Pagerduty
  receivers:
    - name: Pagerduty
      pagerduty_configs:
        - service_key:
            name: pagerduty_service_secret
            key: pagerduty_service_key
Slack example
apiVersion: monitoring.coreos.com/v1alpha1
kind: AlertmanagerConfig
metadata:
  labels:
    edb-alertmanager-config: hcp
  name: slack
  namespace: edb-observability
spec:
  route:
    receiver: Slack
    groupBy: ["alertname", "cluster", "service"]
    routes:
      - receiver: Slack
  receivers:
    - name: Slack
      slack_configs:
        - channel: '#alerts'
          api_url:
            name: slack_api
            key: slack_url
SMTP example
apiVersion: monitoring.coreos.com/v1alpha1
kind: AlertmanagerConfig
metadata:
  labels:
    edb-alertmanager-config: hcp
  name: smtp
  namespace: edb-observability
spec:
  route:
    receiver: SMTP
    groupBy: ["alertname", "cluster", "service"]
    routes:
      - receiver: SMTP
  receivers:
    - name: SMTP
      email_configs:
        - smarthost: 'smtp.example.com:25'
          to: 'operations@example.com'
          from: 'alertmanager@hcp.example.com'
Alerts can be routed to different receivers based on labels and annotations. See the Prometheus Alertmanager documentation and the AlertmanagerConfig CRD reference for full configuration options.
Related topics
- Grafana monitoring — Dashboard visualization, log exploration, and custom dashboards.
- Notifications — Notification channels and delivery configuration.