Loki dashboards for logging monitoring v1.3.2
These dashboards are related to the integrated Loki logging system, allowing you to visualize and analyze your logs. Visualization is limited to the logging namespace only, as it's where Loki performs its operations.
Loki dashboards are prebuilt dashboards called Loki mixins from Grafana's official library.
Loki / Chunks

Description: Monitors the storage and management of log data chunks (a grouping of log entries that belong to a single log stream) in Loki.
Metrics: Metrics include active chunks, percentile utilization, log entries per chunk, chunk lifecycle events (flush operations), chunk size, chunk age, bytes per chunk, and more.
Usage: Helps identify potential storage inefficiencies, understand chunk lifecycle patterns, and troubleshoot issues related to chunk management and query performance.
Loki / Deletion
Description: Tracks the performance and status of Loki's log deletion processes based on retention policies. The default Loki retention period is 30 days.
Metrics: Deletion duration, deletion errors, number of chunks deleted, number of series affected by deletion, and deletion queue length.
Usage: Allows you to verify that your retention policies are being enforced correctly, monitor the efficiency of the deletion process, and identify any errors preventing log deletion. Use this to ensure logs are being pruned as expected.
Loki / Logs
Description: You can view and filter logs ingested by Loki.
Metrics: Logs, rates of logs ingested, and more.
Usage: Provides a visual overview of log data, enabling quick identification of trends and errors. Use this for real-time log analysis and troubleshooting.
Loki / Operational
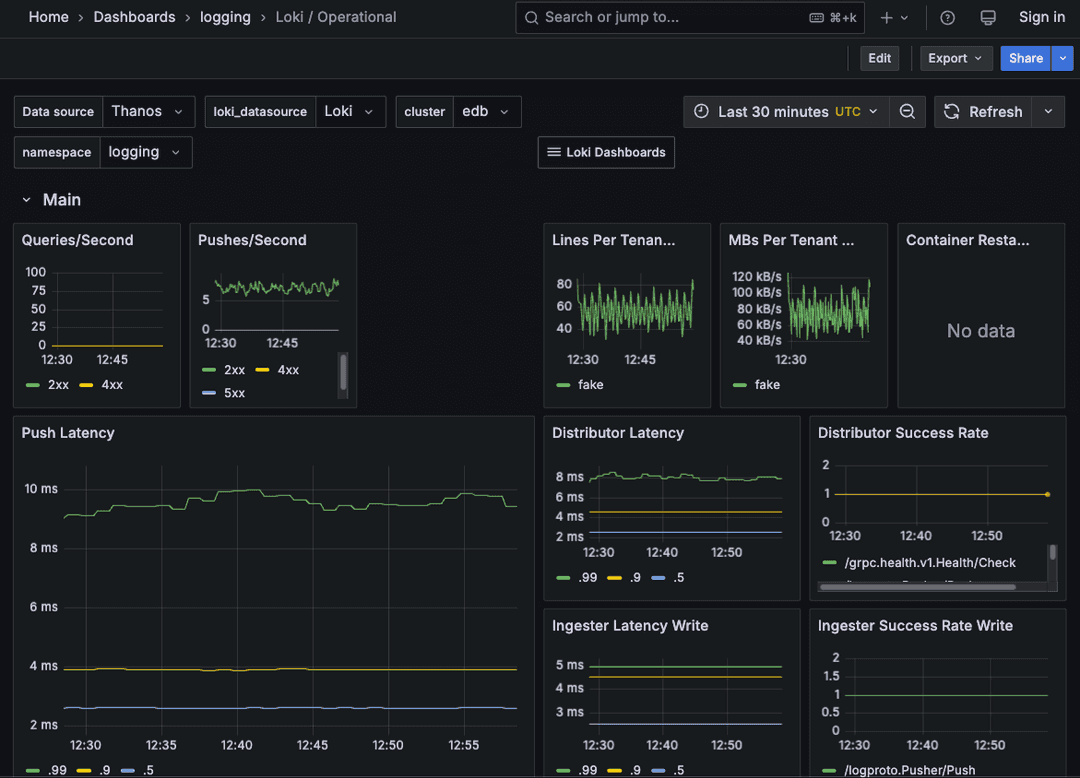
Description: Provides insights into the operational health and performance of the Loki system.
Metrics: Queries and pushes per second, query and push latency, log lines per tenant, MBs usage per tenant, CPU utilization of Loki components (ingesters, distributors, queriers), memory usage of Loki components, streams and chunks over time, and more.
Usage: Helps ensure the stability and performance of the Loki logging system by monitoring its resource consumption and internal health. Identify potential bottlenecks or resource exhaustion in Loki.
Loki / Reads
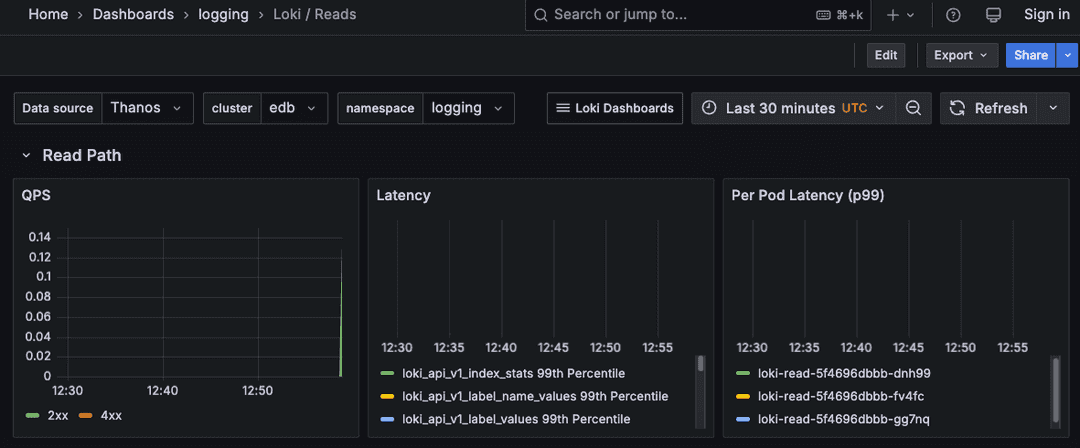
Description: Monitors the performance of log read queries against Loki.
Metrics: Loki read queries per second, latency per read operation and per pod.
Usage: Allows you to assess Loki's responsiveness to log queries.
Loki / Reads Resources
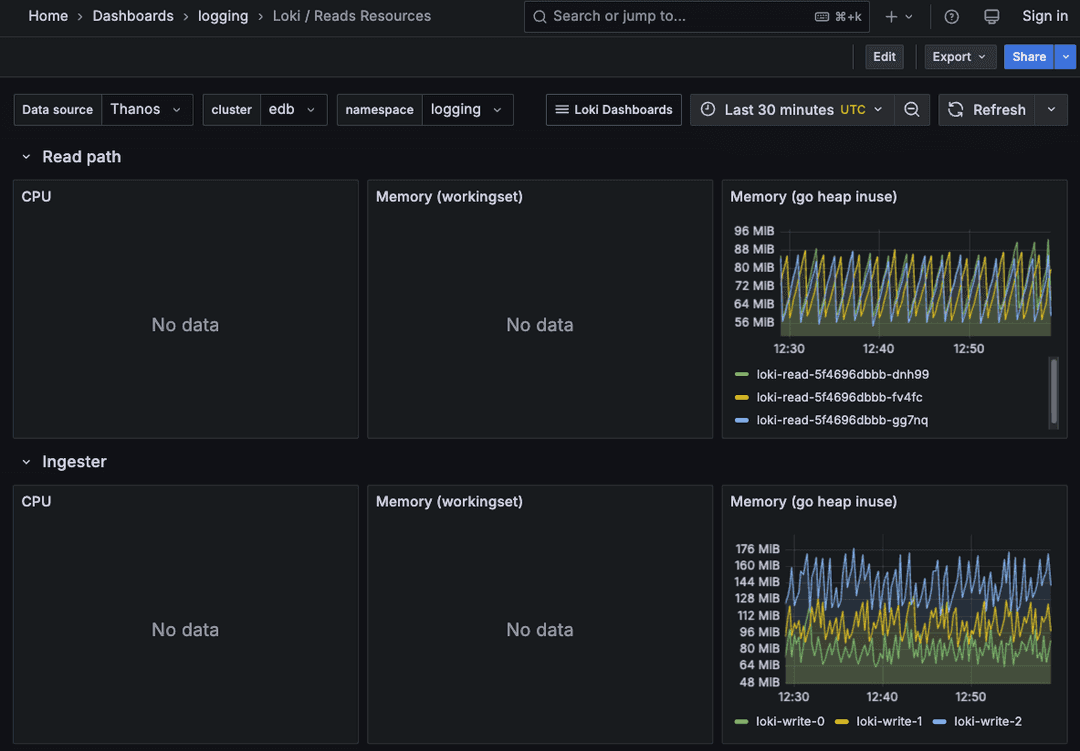
Description: Shows resource consumption (CPU, memory) by Loki read operations.
Metrics: Memory in use by individual Loki read pods and by Loki-ingested pods.
Usage: Helps understand the resource overhead of log read querying.
Loki / Retention
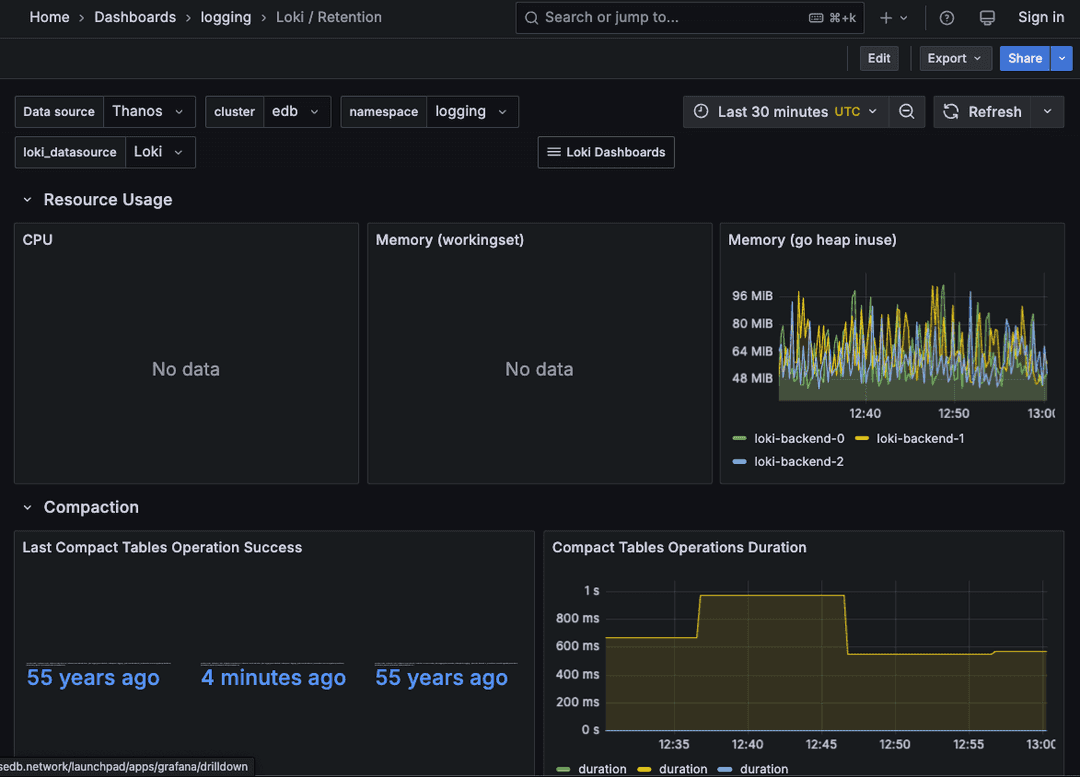
Description: Provides detailed metrics on Loki's log retention policies and their enforcement.
Metrics: Last successful compaction operation, compaction operations by duration and status, memory in use by Loki backend pods (for retention).
Usage: Allows you to verify that your configured retention policies are active and understand their impact on storage consumption in Loki.
Loki / Writes
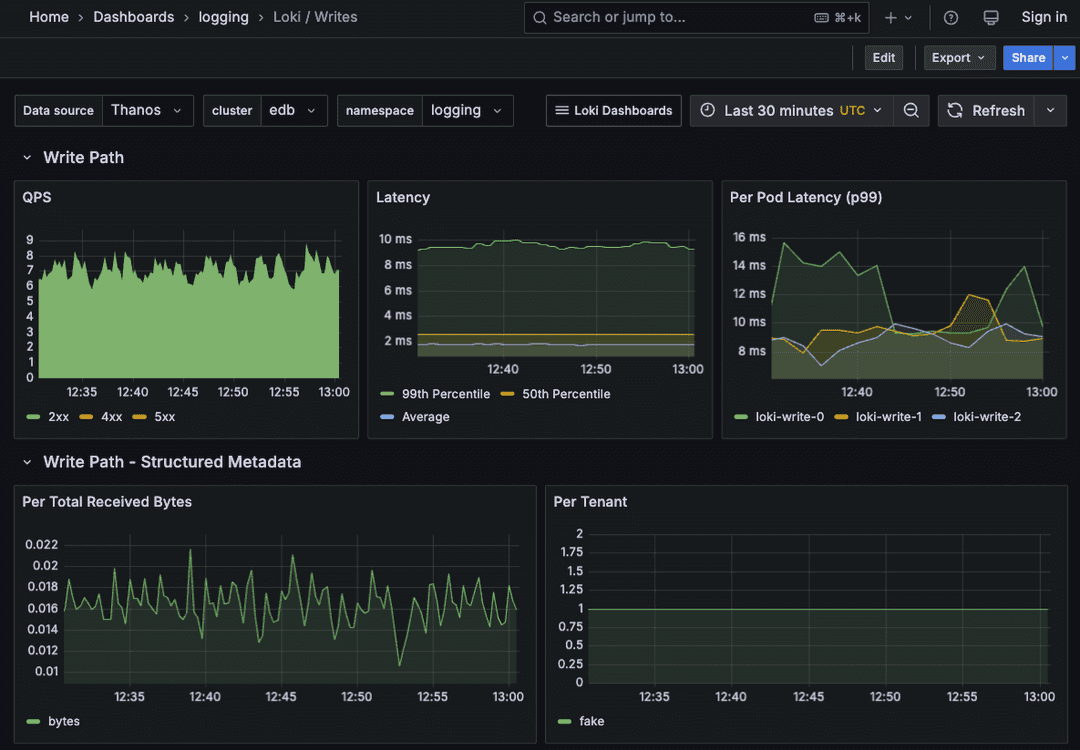
Description: Monitors the performance of log ingestion (writes) queries into Loki.
Metrics: Loki write queries per second, latency per write operation and per pod.
Usage: Helps you identify slow ingestion rates or dropped logs in the log forwarding pipeline from your applications to Loki.
Loki / Writes Resources
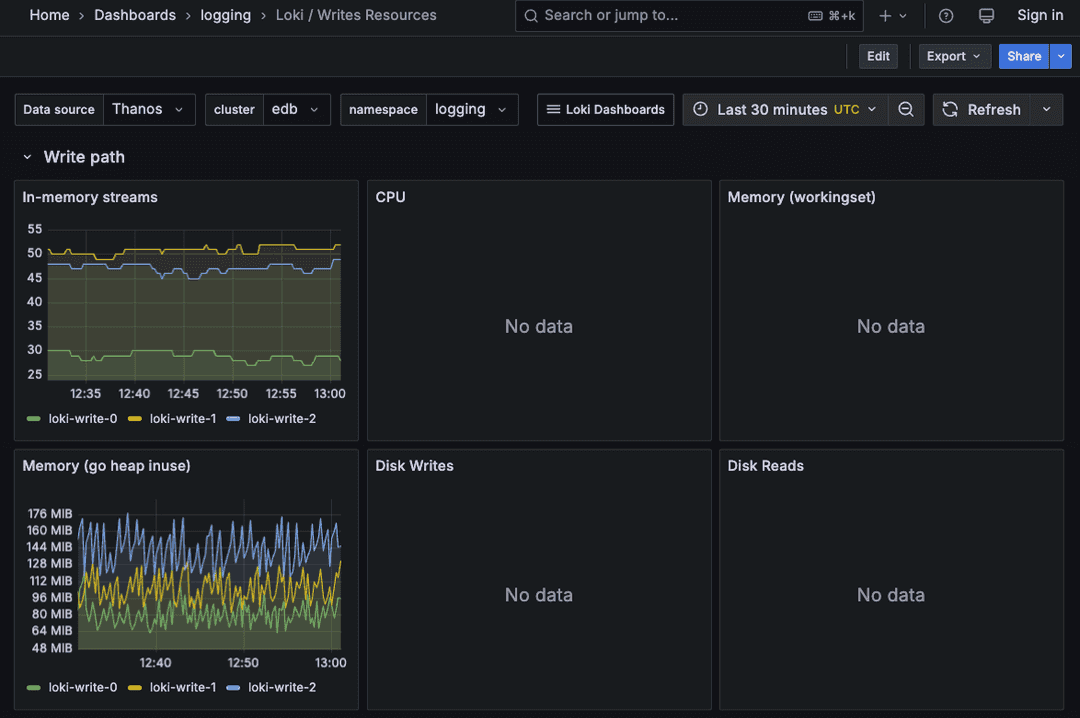
Description: Shows resource consumption (CPU, memory) by Loki write operations.
Metrics: Memory in use by individual Loki write pods and by Loki ingesting pods.
Usage: Helps you understand the resource overhead of log write querying.
Loki Data
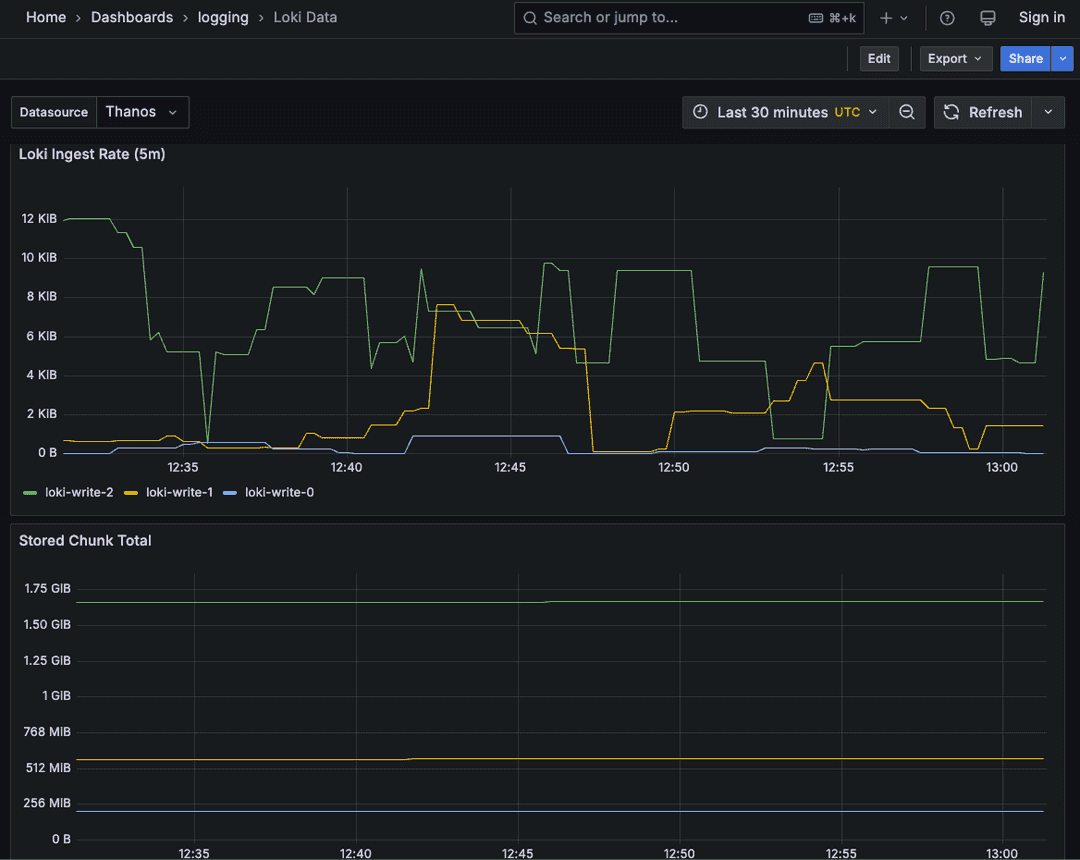
Description: This is a dashboard designed by EDB that provides a high-level view of the amount of log data Loki is managing.
Metrics: Loki ingest rate and total stored chunks in bytes.
Usage: You can use this dashboard for capacity planning, understanding data growth, and managing logging-related storage costs.