Telemetry dashboards v1.3.2
These dashboards provide insights into the Hybrid Manager (HM) platform and its underlying components.
FluentBit
This is a prebuilt Fluent Bit mixin from Grafana's official library.
Description: Provides metrics about the FluentBit instance, which is used to collect logs from the nodes, and ships them to Loki, which in turn informs Hybrid Manager.
Metrics: Input and output processing rates, input and output records rate, failed and error rates, and more.
Usage: Helps identify if FluentBit is experiencing performance bottlenecks, resource exhaustion, or errors in collecting and sending logs from HM components.
Grafana Overview
Description: Provides metrics about the Grafana instance, the platform that collects metrics from different sources and displays them in a single place.
Metrics: Firing alerts, requests per second, latency, and more.
Usage: Allows you to monitor the health and performance of the Grafana instance that you're using to view these dashboards. Identify if Grafana is overloaded or experiencing issues.
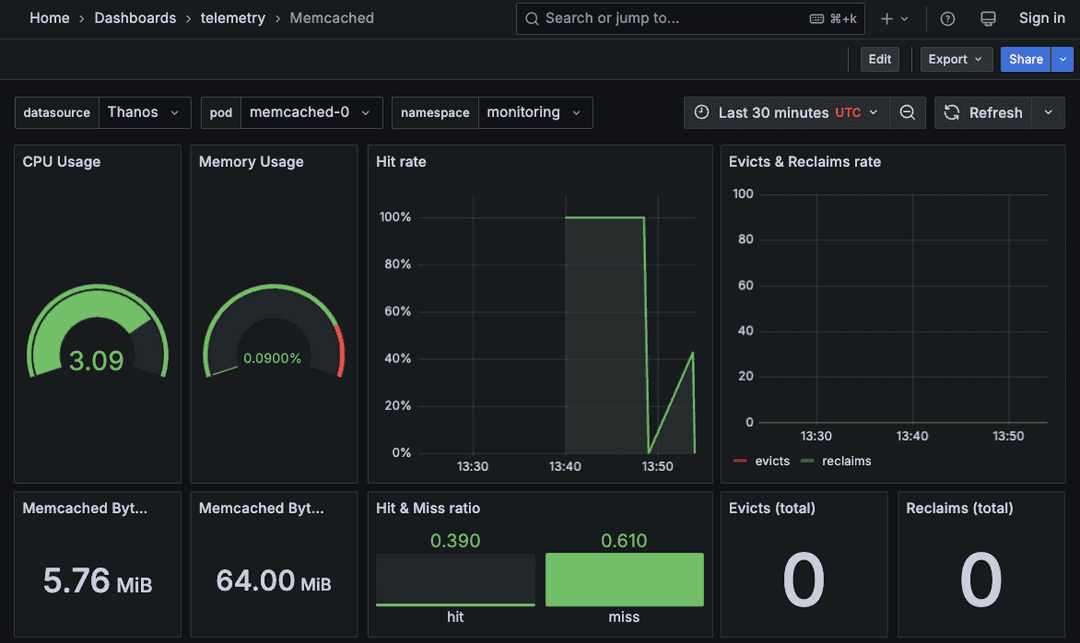
Memcached

Description: Monitors the health and performance of Memcached monitoring services in the HM infrastructure, providing insights into resource utilization, cache efficiency, and eviction rates.
Metrics: CPU and memory usage, hit and miss ratios, evicts and reclaims rate, memcached bytes, and more.
Usage: Use this dashboard to understand the resource consumption of your Memcached instances, evaluate the effectiveness of the cache (hit rate), and monitor how frequently items are being evicted or reclaimed due to memory pressure.
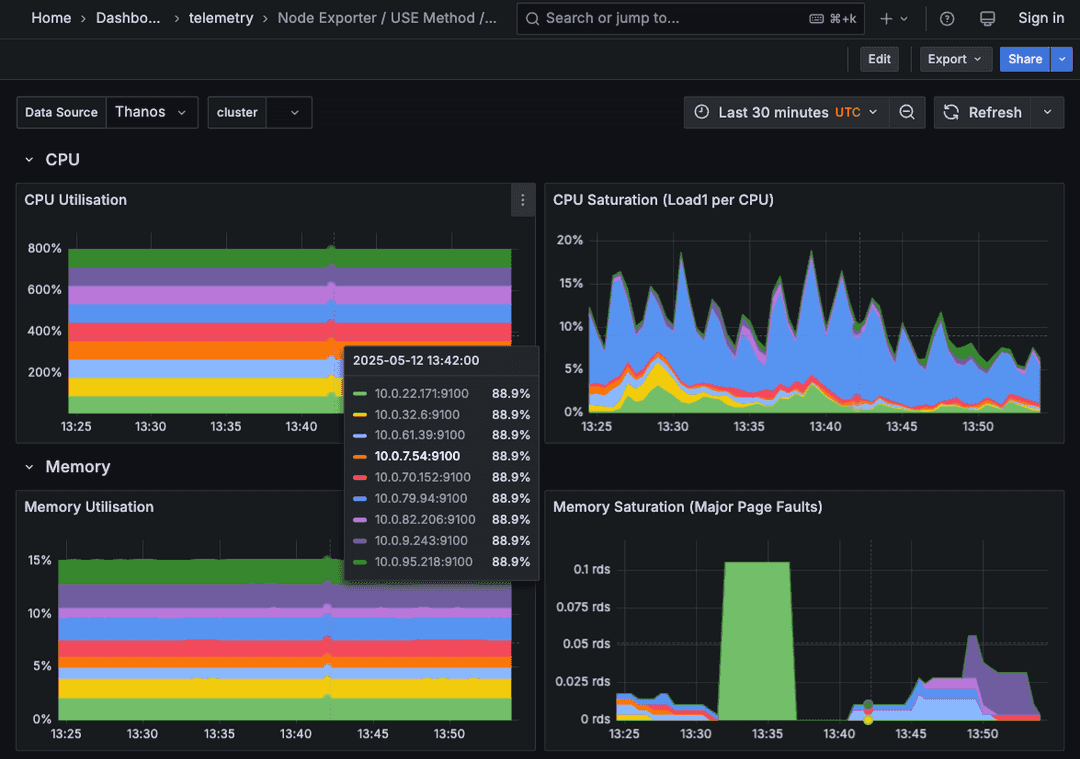
Node Exporter *

These are prebuilt node mixins from Grafana's official library.
Node Exporter metrics are displayed in multiple dashboards that provide different views: Nodes, USE Method / Cluster, and USE Method / Node.
Nodes provides the aggregated resource utilization for a specific node, broken down into types of CPU usage, loads, type of memory, and more.
USE Method / Cluster displays the aggregated resource utilization for the entire Kubernetes cluster, with per-node colorization.
USE Method / Node displays the total resource utilization per node and some metrics for non-volatile memory devices.
Description: Shows hardware metrics for nodes running any of the HM components.
Metrics: CPU utilization, load average, memory usage, disk usage, and more.
Usage: Provides several views of the hardware resources of the servers hosting HM. Useful for identifying resource bottlenecks at the node level.
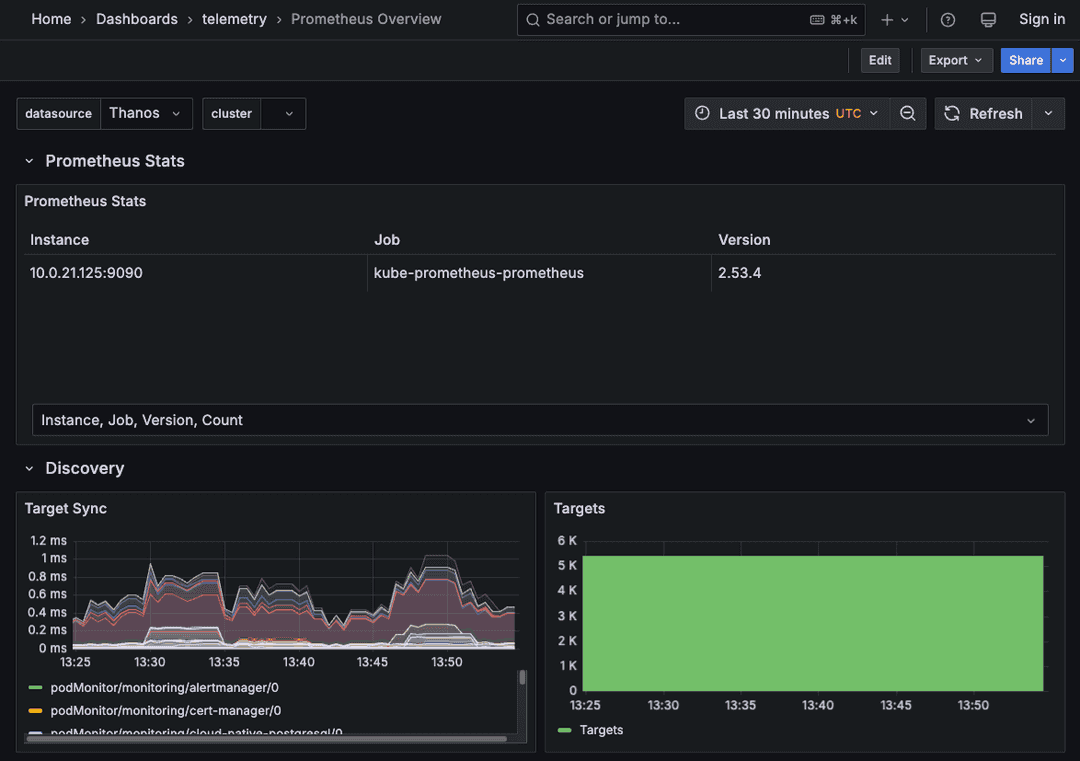
Prometheus Overview

This is a prebuilt Prometheus mixin from Grafana's official library.
Description: Monitors the health and performance of the Prometheus monitoring system, which is used to collect and ship metrics in HM.
Metrics: Prometheus stats, discovery and targets, scrape intervals and failures, query rates, and more.
Usage: Allows you to monitor the health of the Prometheus metric collection engine. Issues with Prometheus can lead to incomplete or delayed monitoring data.
Thanos *

These are prebuilt Thanos mixins from Grafana's official library.
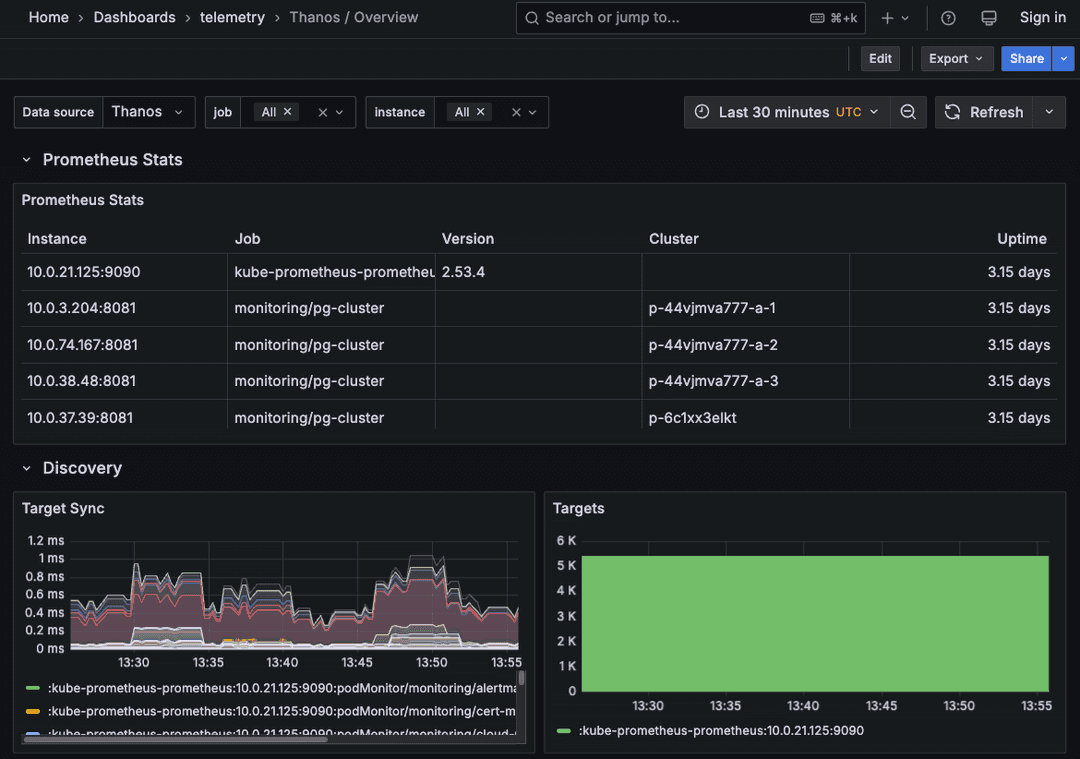
Thanos metrics are displayed in multiple dashboards that provide different views: Compact, Overview, Query, Receive, and Store.
Compact monitors the Thanos compactor, a component used for long-term storage and downsampling of Prometheus metrics.
Overview provides a high-level overview of the Thanos deployment in HM.
Query monitors the Thanos query API, providing rate and duration metrics as well as errors and more.
Receive monitors Thanos incoming requests, providing rate and duration metrics as well as errors and more.
Store monitors Thanos storage jobs, bucket, block, cache operations, and any related errors.
Description: Monitors the performance and health of the Thanos long-term metric storage system.
Metrics: Statistics of Thanos jobs, scrape interval durations, metrics on compaction, query, incoming request and store procedures, procedure latencies, errors, and CPU and memory usage.
Usage: Helps ensure that the long-term storage of metrics is being managed efficiently by Thanos. Issues with the compactor can lead to storage inefficiencies or data loss. Slow Thanos queries and processing of incoming requests can affect the responsiveness of Grafana dashboards and so on.