PGD Monitoring Dashboards v8
The PGD Monitoring Dashboards display the information about replication activities of the PGD Nodes in a PGD Group. There are three different dashboards for PGD:
- PGD Admin Dashboard
- PGD Group Monitoring Dashboard
- PGD Node Monitoring Dashboard
To view the details on these dashboards, you must enable the probes on the PGD Nodes. By default, the PGD Probes are disabled. To enable the probes, highlight the name of the PGD Node in the PEM client browser tree control, and select Manage Probes... from the Management menu. Use the Manage Probes.. tab to enable to Probes.
PGD Admin Dashboard
To view the details on PGD Admin Dashboard enable the following probes:
- PGD Group Camo Details
- PGD Group Locks
- PGD Group Raft Details
- PGD Group Versions Details
- PGD Node Summary
- PGD Worker
- PGD Worker Errors
Then highlight the PGD Node in the PEM client browser and select the PGD Admin from the Dashboards drop down menu.

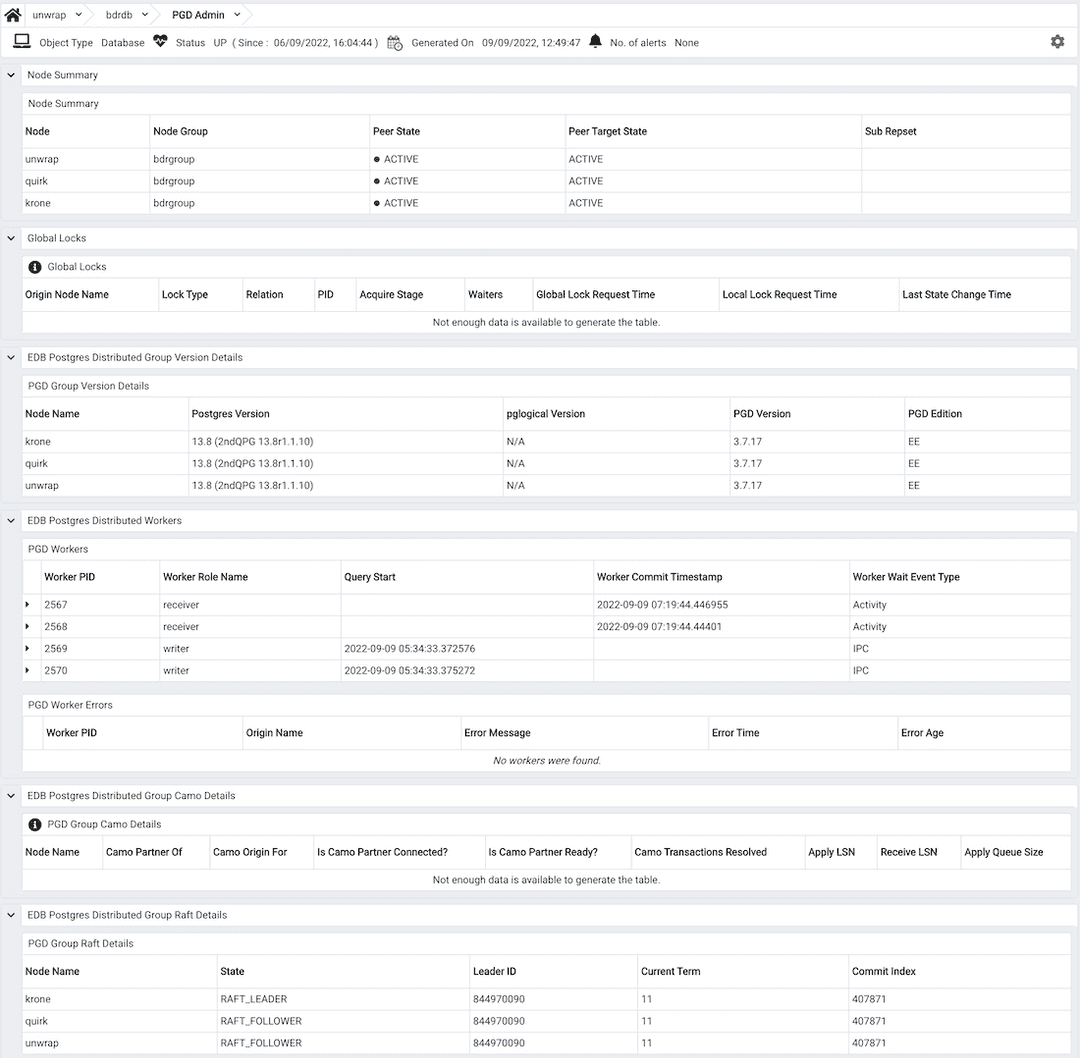
The Node Summary table provides information about all the nodes of PGD Group:
- The
Nodecolumn displays the name of the PGD Node in the PGD Group. - The
Node Groupcolumn displays the name of the PGD Group. - The
Peer Statecolumn displays the status of the particular PGD Node. - The
Peer Target Statecolumn displays the status of the other node which is tried to reach. - The
Sub Repsetcolumn displays the name of the subscribed replication sets.
The Global Locks table provides information about PGD's global locking activity and progress od PGD Group:
- The
Origin Node Namecolumn displays the name of the node from where the global lock is originated. - The
Lock Typecolumn displays the type of the Lock. The possible values areGLOBAL_LOCK_DDLorGLOBAL_LOCK_DML. - The
relationcolumn displays the name of the locked relation(for DML Locks) or keys(for advisory locks). - The
PIDcolumn displays the PID of the process holding the lock. - The
Acquire Stagecolumn displays the internal state of the lock acquisition process. - The
Waiterscolumn displays the list of the backends waiting for the same global lock. - The
Global Lock Request Timecolumn displays the timestamp at which the process of acquiring the global lock started. It can beNullif time is unknown on the current node. - The
Local Lock Request Timecolumn displays the timestamp at which the local node tried to acquire the local lock for this global lock. This includes the time taken for the heavyweight session lock acquire, but does NOT include any time taken on DDL epochs or queue flushing. If the lock is re-acquired after local node restart, this will be the node restart time. - The
Last State Change Timecolumn displays the timestamp at which theAcquire Stagelast changed.
The PGD Group Version Details table provides version information of the installed Postgres, pglogical, PGD, and PGD edition for each node:
- The
Node Namecolumn displays the name of PGD Node in the PGD Group. - The
Postgres Versioncolumn displays the version of the installed postgres on each PGD Node. - The
pglogical Versioncolumn displays the version of the installed pglogical on each PGD Node. - The
PGD Versioncolumn displays the version of the installed PGD extension on each PGD Node. - The
PGD Editioncolumn displays the Edition of the installed PGD extension on each PGD Node. The possible values areEEorSE.
The PGD Workers table provides information about the PGD background worker processes:
- The
Worker PIDcolumn displays the process id of the worker process. - The
Worker Role Namecolumn displays the role name of the worker processes. The possibile values arereceiverorwriter. - The
Query Startcolumn displays the query start timestamp when a particular query started executing. - The
Worker Commit Timestampcolumn displays the timestamp at which the worker process committed the transaction. - The
Worker Wait Event Typecolumn displays the type of wait event for the worker process.
The PGD Worker Errors table provides information about the persistent log of errors from the PGD background worker processes.
- The
Worker PIDcolumn displays the process id of the worker process. - The
Origin Namecolumn displays the name of the PGD Node that initiated the error from the worker process. - The
Error Messagecolumn displays the description of the error from the worker process. - The
Error Timecolumn displays the timestamp of the error from the worker process. - The
Error Agecolumn displays the time elapsed in years, months and days since the error occurred.
The PGD Group Camo Details table provides information relate to CAMO from all the PGD Nodes.
- The
Node Namecolumn displays the name of PGD Node in the PGD Group. - The
Camo Partner ofcolumn displays the node name for whom this node is partner. - The
Camo Origin Forcolumn displays the node name for whom this node is origin. - The
Is Camo Partner Connected?column displays the connection status of the camo partner. - The
Is Camo Partner Ready?column displays the readiness status of the camo partner. - The
Camo Transactions Resolvedcolumn displays if there are any pending and unresolved CAMO transactions. - The
Apply LSNcolumn displays the latest position reported as replayed. - The
Receive LSNcolumn displays the latest LSN of any change or message received. - The
Apply Queue Sizecolumn displays the difference between apply_lsn and receive_lsn in bytes.
The PGD Group Raft Details table provides detail information about the PGD Group Raft:
- The
Node Namecolumn displays the name of PGD Node in the PGD Group. - The
Statecolumn displays the Raft worker state on the PGD Node. - The
Leader IDcolumn displays the Node id of the RAFT_LEADER. - The
Current Termcolumn displays the Raft election internal id. - The
Commit Indexcolumn displays the Raft snapshot internal id.
PGD Group Monitoring Dashboard
To view the details on the PGD Group Monitoring dashboard enable the following probes:
- PGD Group Replication Slots Details
- PGD Group Subscription Summary
Then highlight the PGD Node in the PEM client browser and select the PGD Group Monitoring from the Dashboards drop down menu.

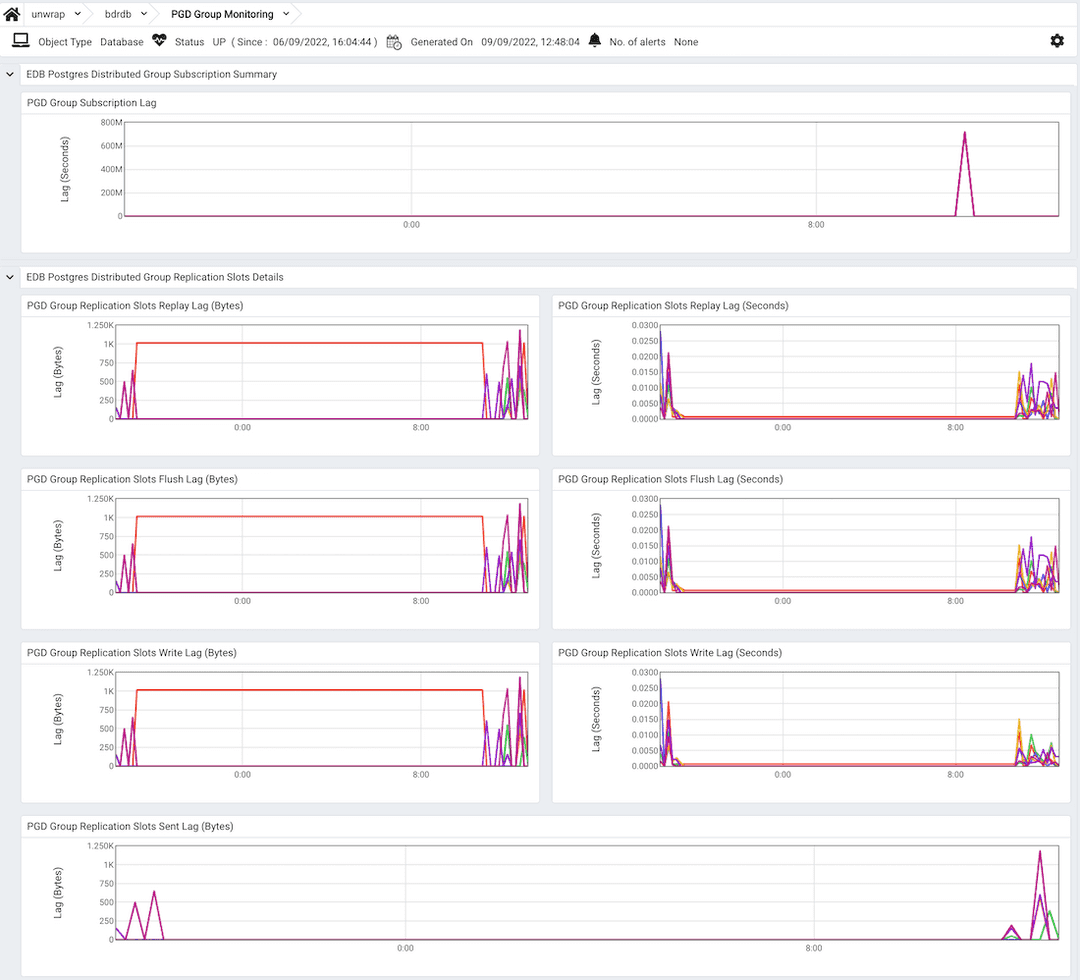
- The
PGD Group Subscription Laggraph displays the delay to apply the transactions on subscribed nodes as compared to the origin. The delay in applying transactions between the subscribed node and origin is displayed with different colors on the graph. The vertical key on the left side of the graph indicates the delay to apply the transactions on subscribed nodes in seconds as compared to the origin. - The
PGD Group Replication Slots Replay Lag(Bytes)graph displays the difference between the replay_lsn and current WAL write position in bytes. The difference among the different set of replication slots is displayed with different color on the graph. The vertical key on the left side of the graph indicates the difference in bytes. - The
PGD Group Replication Slots Replay Lag(seconds)graph displays the approximate lag time for reported replay among the replication slots. The delay time between the subscribed replication slots is displayed with different colors on the graph. The vertical key on the left side of the graph indicates the lag time in seconds. - The
PGD Group Replication Slots Flush Lag(Bytes)graph displays the difference between the flush_lsn and current WAL write position in bytes. The difference among the different set of replication slots is displayed with different colors on the graph. The vertical key on the left side of the graph indicates the difference in bytes. - The
PGD Group Replication Slots Flush Lag(seconds)graph displays the approximate lag time for reported flush among the replication slots. The delay time between the subscribed replication slots is displayed with different colors on the graph. The vertical key on the left side of the graph indicates the lag time in seconds. - The
PGD Group Replication Slots Write Lag(Bytes)graph displays the difference between the write_lsn and current WAL write position in bytes. The difference among the different set of subscribed replication slots is displayed with different colors on the graph. The vertical key on the left side of the graph indicates the difference in bytes. - The
PGD Group Replication Slots Write Lag(seconds)graph displays the approximate lag time for reported write among the replication slots. The delay time between the subscribed replication slots is displayed with different colors on the graph. The vertical key on the left side of the graph indicates the lag time in seconds. - The
PGD Group Replication Slots Sent Lag(Bytes)graph displays the difference between sent_lsn and WAL write position in bytes. The difference among the different set of subscribed replication slots is displayed with different colors on the graph. The vertical key on the left side of the graph indicates the difference in bytes.
PGD Node Monitoring Dashboard
To view the details on the PGD Node Monitoring dashboard enable the following probes:
- PGD Conflict History Summary
- PGD Node Replicate Rates
- PGD Node Slots
Then highlight the PGD Node in the PEM client browser and select the PGD Node Monitoring from the Dashboards drop down menu.

- The
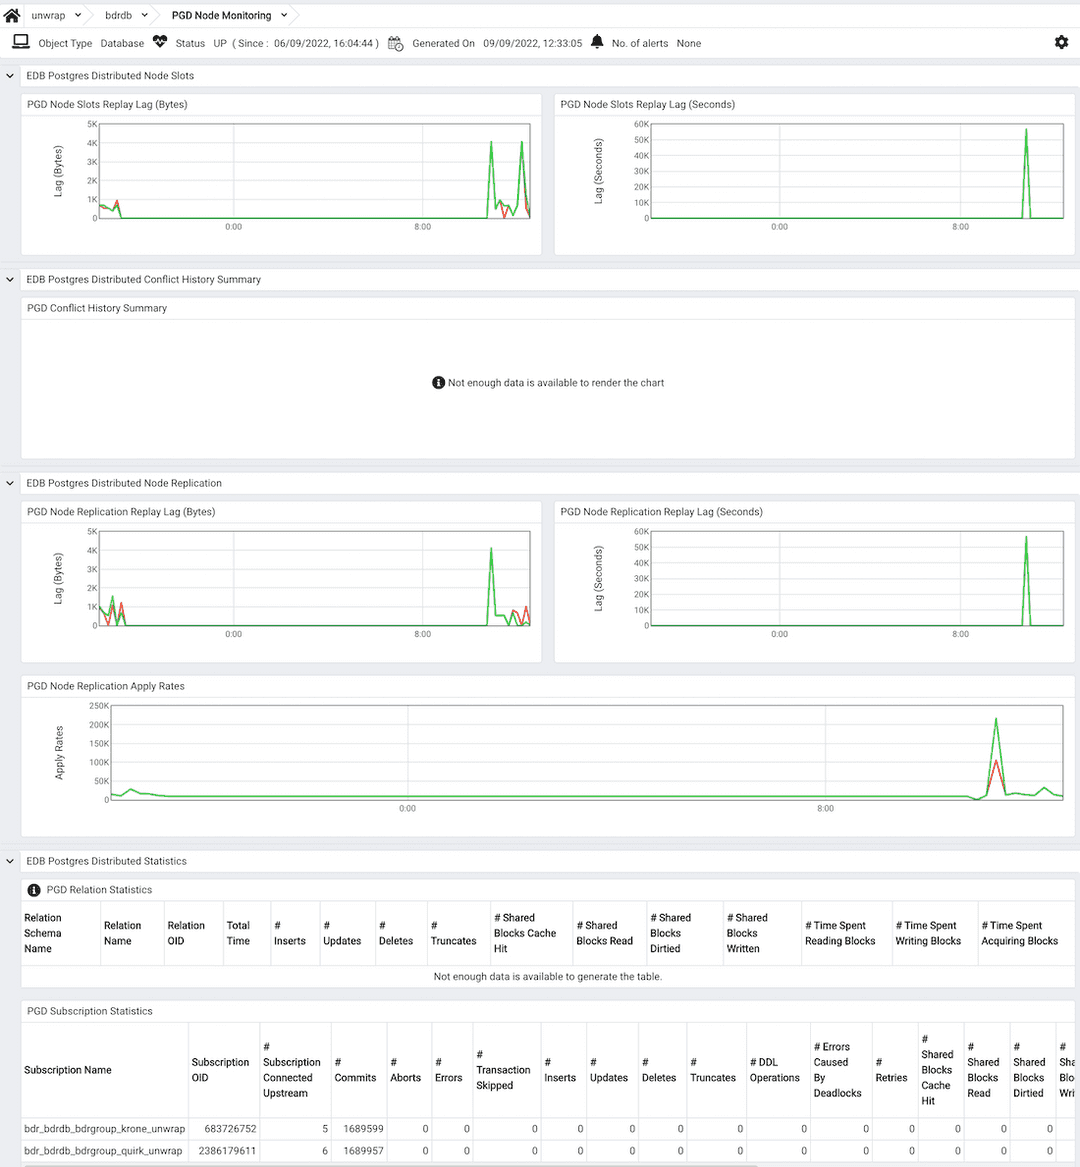
PGD Node Slots Replay Lag(Bytes)graph displays the difference between the replay_lsn and current WAL write position in bytes for the particular PGD Node. The vertical key on the left side of the graph indicates the difference in bytes. - The
PGD Conflict History Summarygraph displays the summary on the conflict history per conflict type for the particular PGD Node. The vertical key on the left side of the graph indicates the number of row conflicts. - The
PGD Node Replication Replay Lag(Bytes)graph displays the difference between the replay_lsn and current WAL write position on origin in bytes for the particular PGD Node. The vertical key on the left side of the graph indicates the difference in bytes. - The
PGD Group Replication Slots Replay Lag(seconds)graph displays the approximate lag time for reported replay among the replication slots for the particular PGD Node. The vertical key on the left side of the graph indicates the lag time in seconds. - The
PGD Node Replication Apply Ratesgraph displays the information about the outgoing replication activity from a given PGD Node. The vertical key on the left side of the graph.