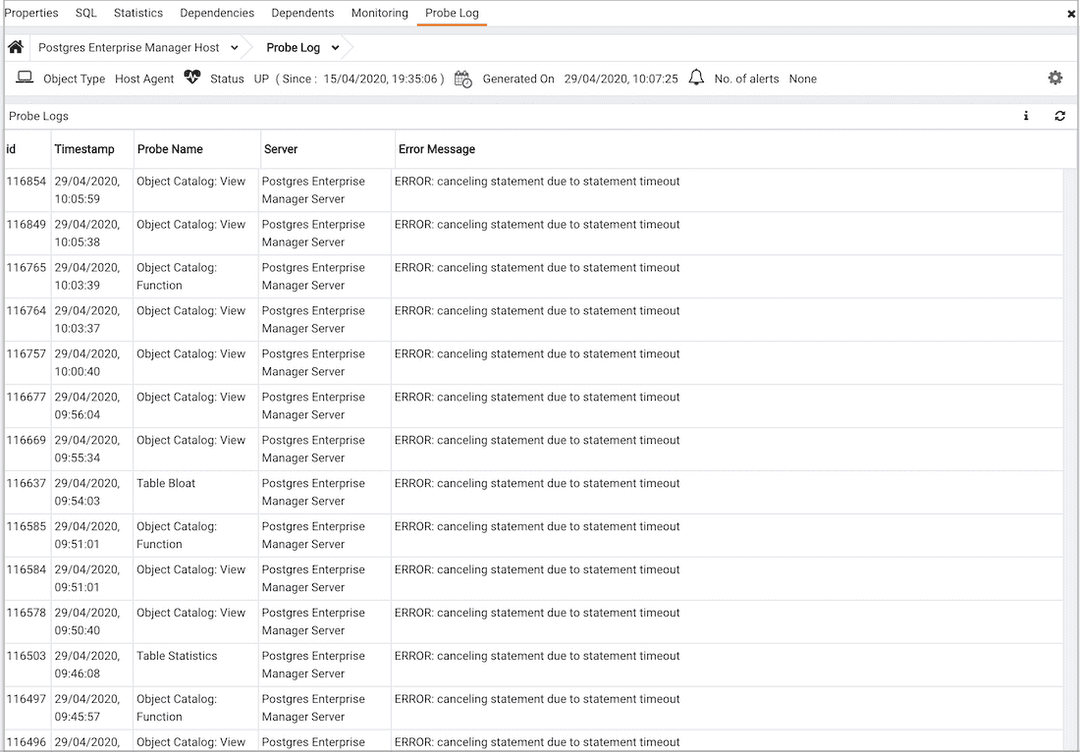
The Probe Log Analysis Dashboard v8
The Probe Log Analysis dashboard displays error messages from the PEM agent.

The header information includes the date and time that the server was first started, the date and time that the page was last updated, and the current number of triggered alerts.
Use parameters on the PEM Server Configurations dialog to specify the auto-refresh rate for the dashboard. To access the Server Configuration dialog, select Server Configuration... from the PEM web interface Management menu.
The Probe Log table displays error messages returned by the PEM Agent. Entries in the Probe Log table may reflect incorrect agent binding information or authentication errors between the PEM agent and the server.
- The
Idcolumn displays a unique identifier for each entry in the table. - The
Timestampcolumn displays the date and time that the log entry was made. - The
Probe Namecolumn displays the name of the probe that recorded the log entry. - The
Server Namecolumn displays the name of the server on which the error occurred. - The
Error Messagecolumn displays the error message returned by the probe.