The Global Overview Dashboard v8
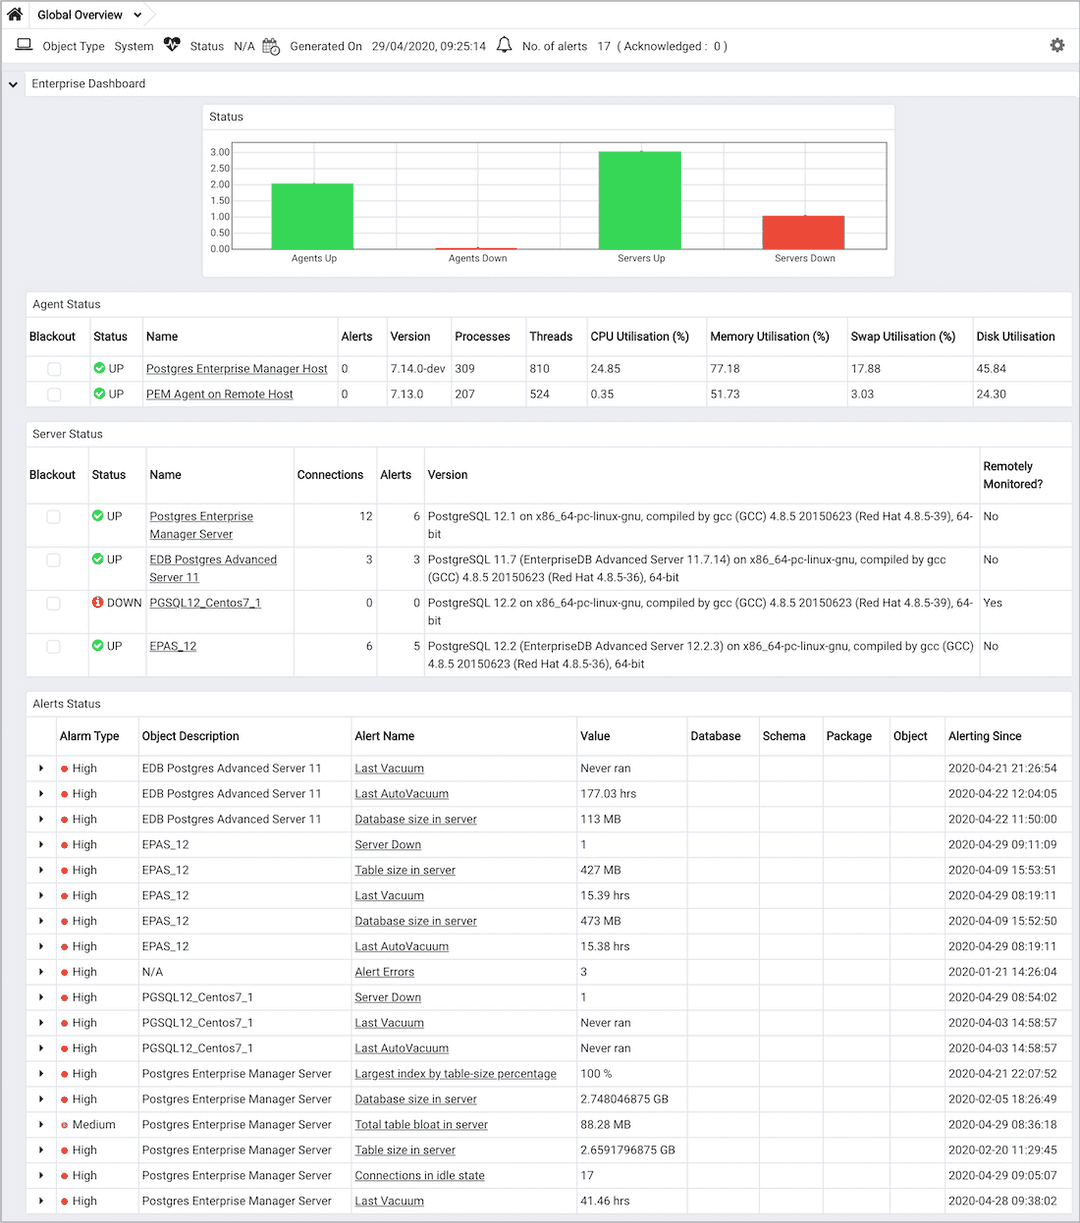
Upon connecting to Postgres Enterprise Manager, the web interface displays the Global Overview dashboard. The Global Overview dashboard displays the status of each PEM server and agent, and calls your attention to any triggered alerts on monitored objects.

Use parameters on the PEM Server Configurations dialog to specify the auto-refresh rate for the dashboard. To access the Server Configuration dialog, select Server Configuration... from the PEM web interface Management menu.
The Global Overview header displays the date and time that the overview was last updated and the current number of triggered alerts.
The Enterprise Dashboard bar graph provides an at-a-glance overview of the status of your PEM agents and servers.
The Agent Status table provides detailed information about the status of each individual PEM agent:
- Check the box in the
Blackoutcolumn to disable alert processing for the agent and all servers monitored by the agent. This is useful when undertaking maintenance on the agent or the host on which the agent runs. - The
Statuscolumn reports the current state of the agent;UP,DOWNorUNKNOWN. A healthy agent displays a green 'check' circle icon; an agent that is down displays a red 'info' circle icon; an agent registered with PEM, but - never sent an heartbeat, displays a gray 'question' circle icon. If user changes the colour for UP, DOWN or UNKNOWN status of agents in *Enterprise Dashboard* bar chart, then that color will be reflected for the respective status icon. - The
Namecolumn displays the name of the agent. Click the name to navigate to theOperating System Analysisdashboard for the selected host. - The
Alertscolumn displays the number of current alerts triggered on the server. - The
Versioncolumn displays the agent's version. - The
Processescolumn lists the number of processes running on the agent's host. - The
Threadscolumn lists the number of threads running on the agent's host. - The
CPU Utilisation (%)column shows the average utilisation of all CPU cores on the host. - The
Memory Utilisation (%)column shows the percentage of available RAM memory used on the host. - The
Swap Utilisation (%)column shows the percentage of available swap memory used on the host. - The
Disk Utilisationcolumn shows the total percentage of disk space used, for all disks on the host.
The Postgres Server Status table provides detailed information about the status of each individual server:
- Check the box in the
Blackoutcolumn provides a checkbox to disable alert processing for the server. This is useful when performing maintenance on the server. - The
Statuscolumn reports the current state of the server; UP, DOWN, UNKNOWN or UNMANAGED. - A healthy server displays a green 'check' circle icon; a disabled server displays a red 'info' circle icon; an unknown server displays a grey 'question' circle icon; an unmanged server displays a light gray 'user' circle icon. If user changes the colour for UP, DOWN, UNKNOWN or UNMANAGED servers in Enterprise Dashboard bar chart, then that color will be reflected for the respective status icon.
- The
Namecolumn displays the name of the agent. Click the name to navigate to theOperating System Analysisdashboard for the host. - The
Connectionscolumn reports the current number of connections to the server. - The
Alertscolumn displays the number of current alerts triggered on the server. - The
Versioncolumn lists the PostgreSQL version and build signature. - The
Remotely Monitoredcolumn displays aYesif the PEM agent that is bound to the monitored server does not reside on the same host as the server, and aNoif the agent resides on the same host as the server.
Triggered alerts displayed in the Alert Status table include both PEM-defined alerts and user-defined alerts for all PEM-monitored hosts, servers, agents and database objects. The Alert Status table will also display an alert if an agent or server is down.
- The
Alarm Typecolumn reports the alert severity. An icon displays in red for aHighseverity alert, in yellow for aMediumseverity alert, and in grey for aLowseverity alert. - The
Object Descriptioncolumn displays a description of the object that triggered the alert. - The
Alert Namecolumn displays the name of the triggered alert. When viewing the dashboard in the PEM client, you can click the Alert Name to open the configuration dialogue for the alert. - The
Valuecolumn displays the current value of the object that triggered the alert. - The
Databasecolumn displays the name of the database with which the alert is associated (if applicable). - The
Schemacolumn displays the name of the schema with which the alert is associated (if applicable). - The
Packagecolumn displays the name of the package with which the alert is associated (if applicable). - The
Objectcolumn displays the name of the object with which the alert is associated (if applicable). - The
Additional Paramscolumn displays any additional parameters specified for the alert. - The
Additional Param Valuescolumn displays any additional parameter values specified for the alert. - The
Alerting Sincecolumn displays the date and time at which the alert triggered.