The Operating System Analysis Dashboard v8
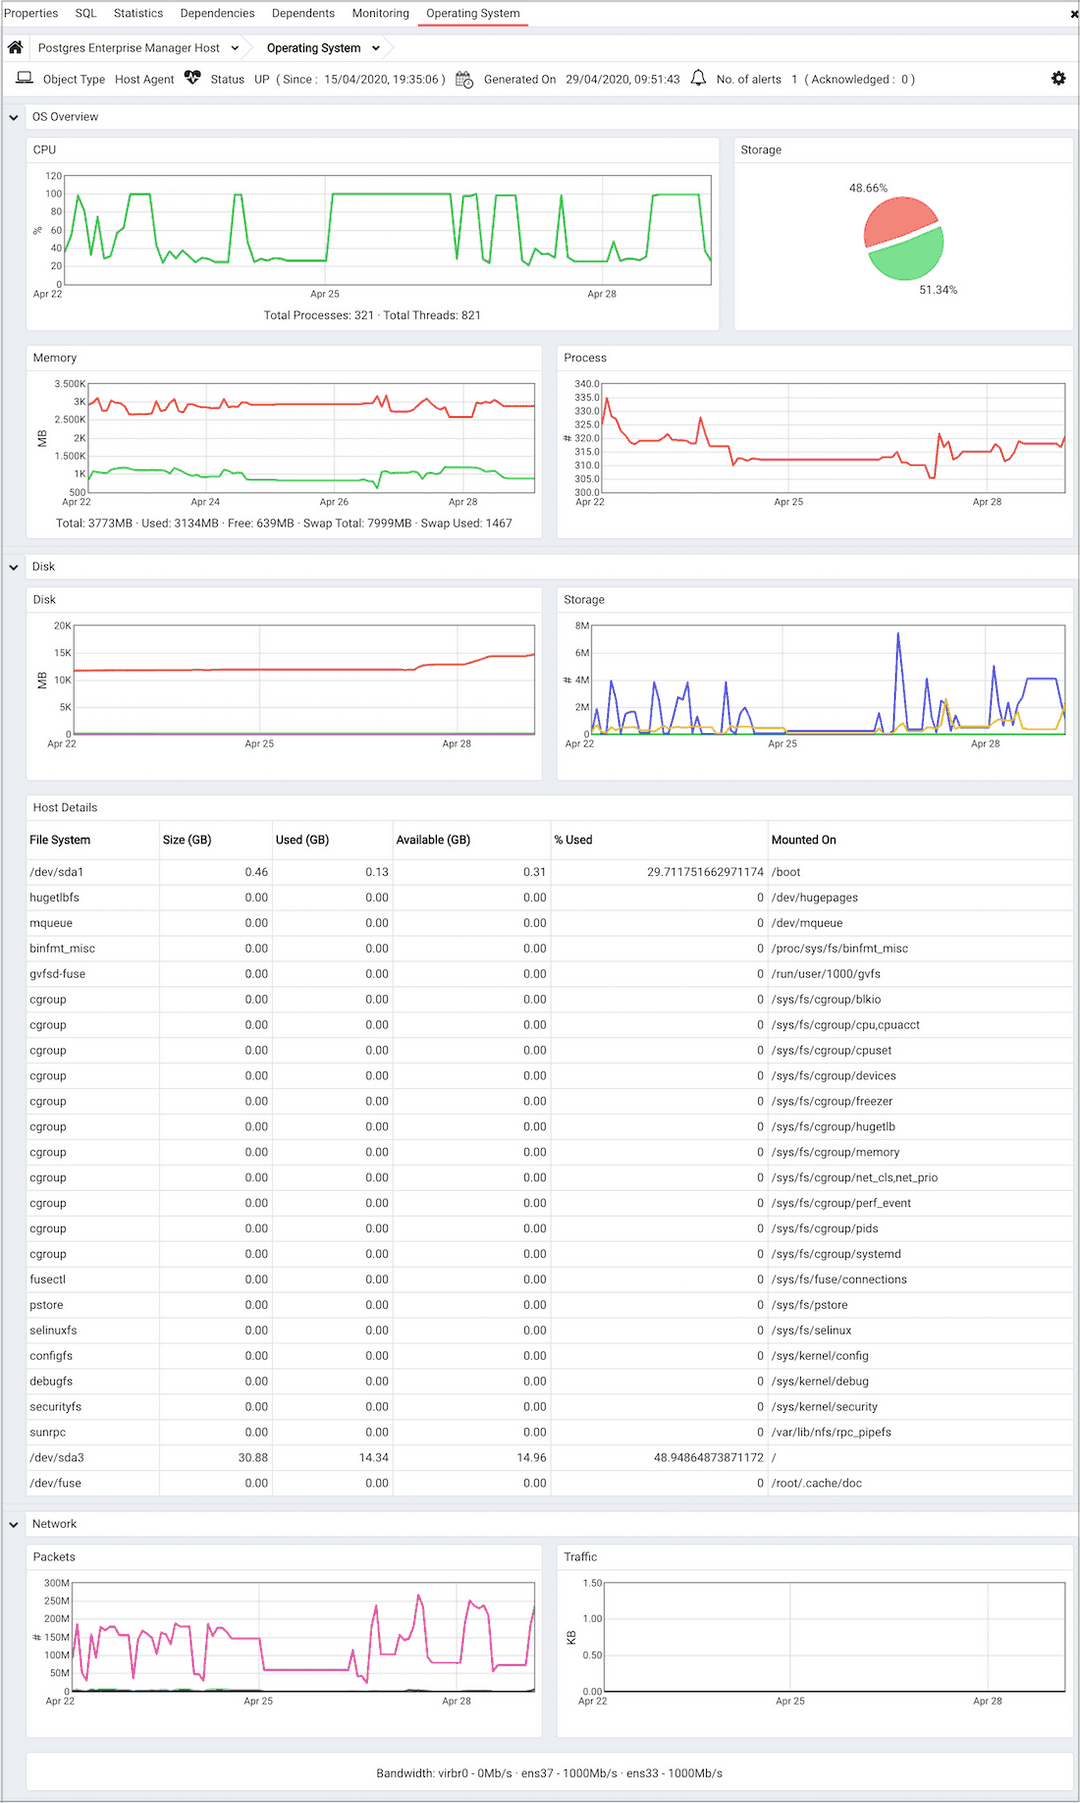
The Operating System Analysis dashboard provides a graphical analysis of the resource usage on the system hosting the selected agent.

Use parameters on the PEM Server Configurations dialog to specify the auto-refresh rate for the dashboard. To access the Server Configuration dialog, select Server Configuration... from the PEM web interface Management menu.
The Operating System Analysis dashboard header displays the date and time that the server was last booted, the date and time that the display was last updated, and the number of triggered alerts on the system.
The Operating System Analysis dashboard provides an overview of system resources. Within the OS Overview section:
- The
CPUgraph represents the percentage of the CPU used at a given point in time. The vertical key on the left side of the graph indicates the percentage. - Segments of the
Storagepie chart represent the free and used storage on the host. - The
Memorygraph displays the memory usage on the PEM server. - The
Processgraph plots the number of processes on the system. A vertical key on the left side of the graph displays the process count.
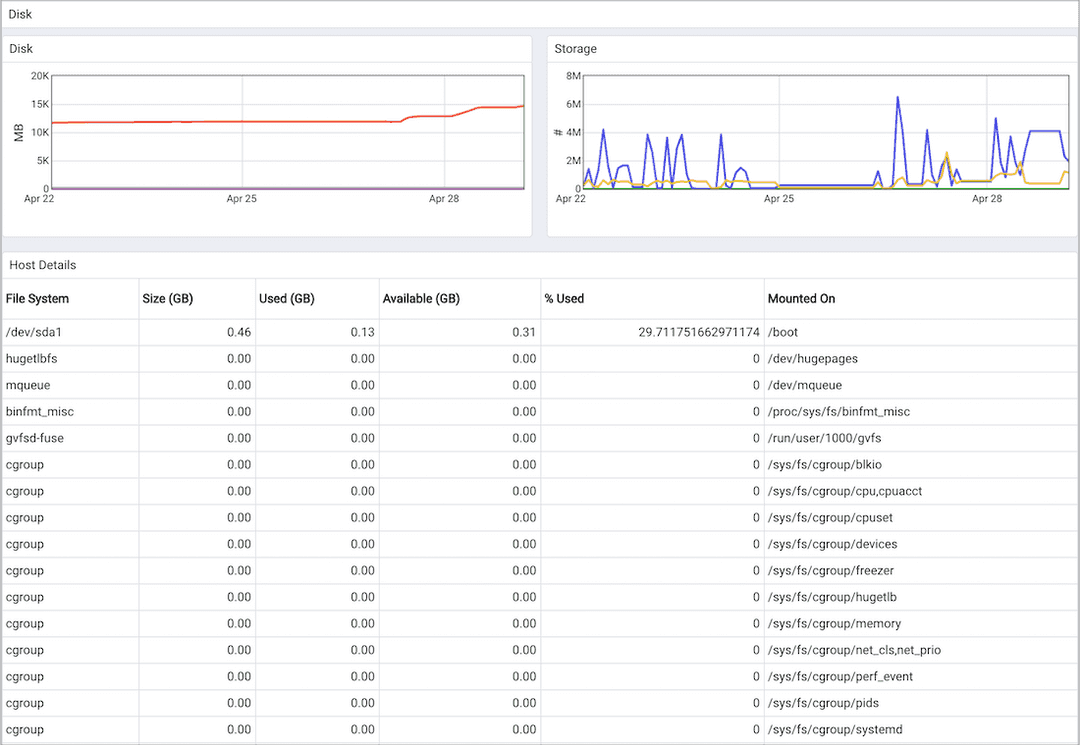
The Disk section of the Operating System Analysis dashboard displays charts and information about operating system disk usage.

The
Diskgraph displays the amount of disk space used. The vertical key on the left side of the chart displays the amount of disk space used (in Megabytes). Each horizontal line on the graph represents a different mounted file system; a file system key is provided in theLegend.The
I/Ograph displays the blocks read from and written to disk. A vertical key on the left side of the graph provides a block count.The
Host File System Detailstable provides information about the host file system:- The
File Systemcolumn displays the name of the file system. - The
Size (GB)column displays the size of the file system in Gigabytes. - The
Used (GB)column displays the amount of the file system that is currently storing information. - The
Available (GB)column displays the amount of space still available on the file system. - The
% Usedcolumn displays the percentage of the total storage space in use. - The
Mounted Oncolumn displays the directory or drove on which the file system is mounted.
- The
Graphs in the Network section of the Operating System Analysis dashboard plot the network and packet traffic:

- The
Packetsgraph displays the number of packets sent and received across the network. TheLegendprovides a key to the color charted for each network interface. The vertical key on the left side of the graph indicates the packet count. - The
Trafficgraph displays the amount of data transferred across the network. TheLegendprovides a key to the color charted for each network interface. The vertical key on the left side of the graph displays the traffic, in KB.
Please note: The network bandwidth may not display if the monitored server is a Linux platform that resides in a virtual machine. This is expected behavior.