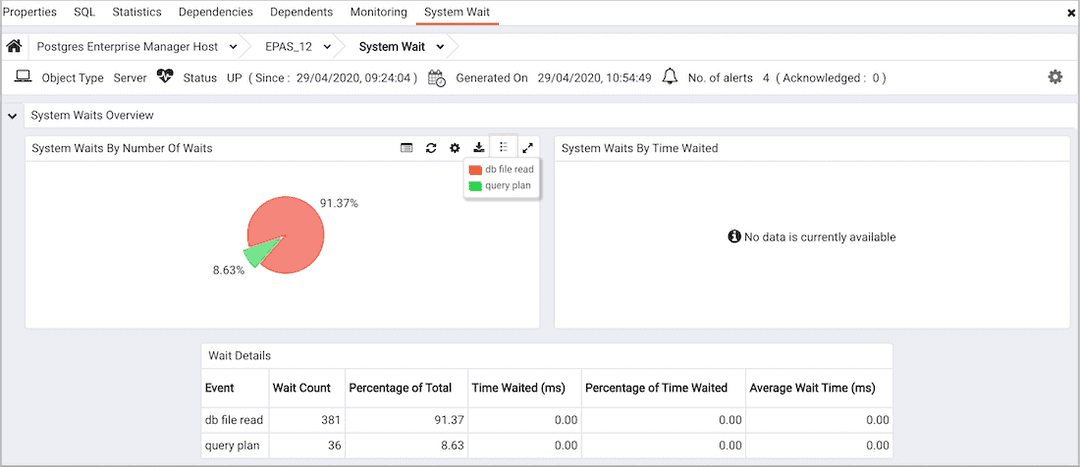
The System Wait Analysis Dashboard v8
The System Wait Analysis dashboard provides an overview of the current DRITA wait events for an Advanced Server database. For more information about DRITA wait events, please see the EDB Postgres Advanced Server Guide.

Use parameters on the PEM Server Configurations dialog to specify the auto-refresh rate for the Alerts dashboard. To access the Server Configuration dialog, select Server Configuration... from the PEM web interface Management menu.
The System Waits Analysis dashboard header displays the date and time that the server started, the date and time that the System Waits Analysis dashboard was last updated, and the number of alerts currently triggered for the specified database (and monitored objects that reside within that database).
The System Waits Overview displays statistics gathered by the most recent execution of the PEM probe:
- The
System Waits by Number of Waitspie chart displays the 5 most frequently encountered wait events for the selected Advanced Server server. For more information about the events that can cause a wait event, see the EDB Postgres Advanced Server Guide. - The
System Waits by Time Waitedpie chart displays the 5 wait events that consume the most time for the selected Advanced Server server. To gather and display data in theSystem Waits by Time Waitedpie chart, you must modify thepostgresql.conffile for the monitored server, setting timed_statistics = on, and restart the server. Please note that this will cause server performance to degrade. For more information about using Advanced Server DRITA timers, please see the EDB Postgres Advanced Server Guide.
The System Waits Details table lists the current system wait events for the selected server. Click a column heading to sort the table by the column data; click again to reverse the sort order.The table displays:
- The
Eventcolumn displays the name of the wait event. - The
Wait Countcolumn contains the number of times that the wait event occurred. - The
Percent of Totalcolumn displays the percentage of the total wait count consumed by this event. - The
Time Waited (ms)displays the number of milliseconds that the server waited for the event. - The
Percent of Time Waiteddisplays the percentage of the total wait time consumed by this event. - The
Average Wait Time (ms)column displays the average wait time for this event.
To gather and display data in the Time Waited (ms) and Percent of Time Waited columns, you must modify the postgresql.conf file for the monitored server, setting timed_statistics = on, and restart the server. Please note that this will cause server performance to degrade. For more information about using Advanced Server DRITA timers, please see the EDB Postgres Advanced Server Guide.