Harnessing Shared Buffers - Part 2

Many Postgres DBAs have faced the trials and tribulations associated with properly configuring Shared Buffers. In Part One of this series, we examined how this venerable configuration parameter causes Postgres to behave when encumbered with rusty old storage media. In this context, more Shared Buffers gave us better performance for OLTP workloads, while smaller values worked best for OLAP use cases.
But what about newer hardware with vastly improved storage characteristics? What happens when we dramatically reduce the cavernous divergence in random operation speed between system RAM and storage? How does this picture look with modern hardware?
Harder, better, faster, stronger
Part of running benchmarks is selecting a wide variety of hardware. Our older systems sufficed for satisfying our curiosity regarding traditional configuration recommendations, but we wanted to know if these old adages held up. That meant a few well placed purchase orders!
Given the focus of our benchmarks on the older hardware was to observe behavior of the antiquated HDD technology, we wanted to contrast that with enterprise-class SSDs. Most hot-swap SSDs will dramatically outperform HDDs, so we refrained from purchasing more capable PCIe or M.2 high-performance drives. We opted for four Dell PowerEdge R7525 servers equipped with dual AMD EPYC 7302 processors (64 threads), 128GB of RAM, and six 800GB SSD devices configured for RAID-0.
While not the beefiest of servers, they’re more than adequate for our purposes. So how do things look with 2021-era bare metal?
Revisiting pgbench
Recall that pgbench uses a simplistic transaction consisting of one select, one insert, and three update statements driven by primary key lookups. Based on this usage pattern, our previous benchmarks measured improvement depending on how much of the database could fit in Shared Buffers.
Better equipped hardware brings more demanding benchmark loads. This time, we bootstrapped the benchmark database with a scale factor of 15,000 for a database size of about 219GB. This gives us a pgbench_account table with 1.5-billion rows, an eye-watering amount most DBAs would dread. A database of this size is still often dwarfed by real production systems, but all we need is more data than available RAM. More CPU threads also meant we had to increase the client count from 225 to 450; we don’t want to take it easy on these systems. As a reminder, our benchmark software flushes filesystem cache and buffers between tests, so no test run gets an unfair advantage. As always, tests run for one hour.
The results were positively astounding:
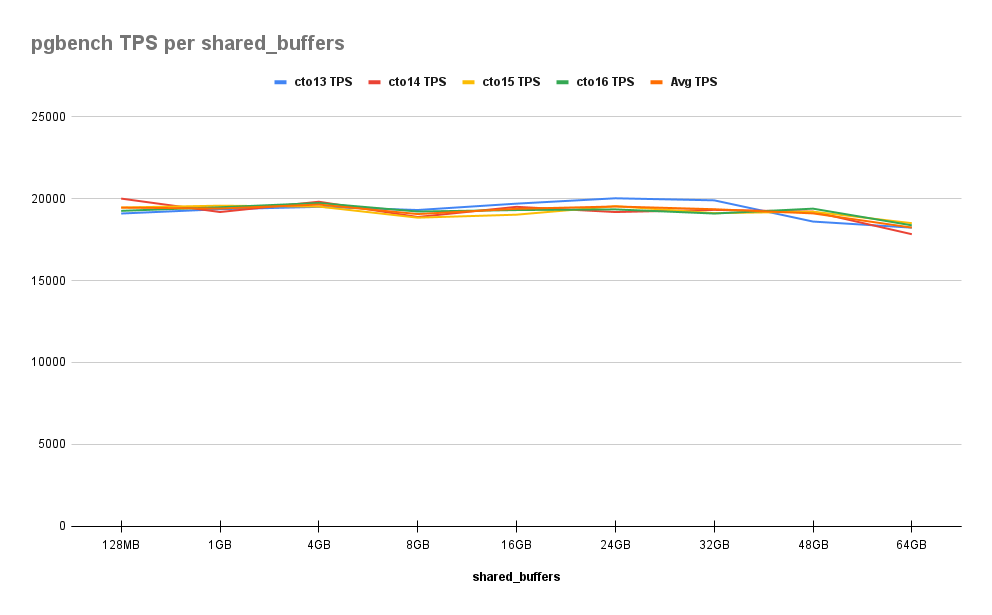
While the older hardware only managed to deliver a maximum of about 1100 TPS, the more modern systems seem to maintain a constant 19,000TPS. That’s nearly a 20x improvement even with a larger data corpus! What’s awkward here is that Shared Buffers provided no measurable benefit at all. In fact, once we reach 48GB, performance starts to noticeably degrade, dropping by 2% and then 6% from baseline.
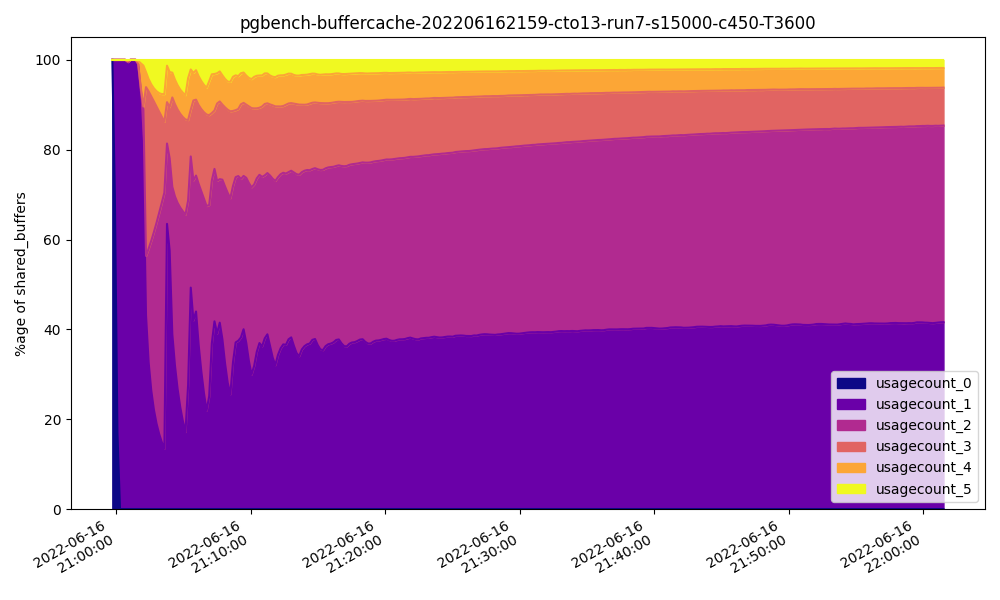
Let’s look at the 32GB buffer usage chart:
And contrast it with the 64GB chart:
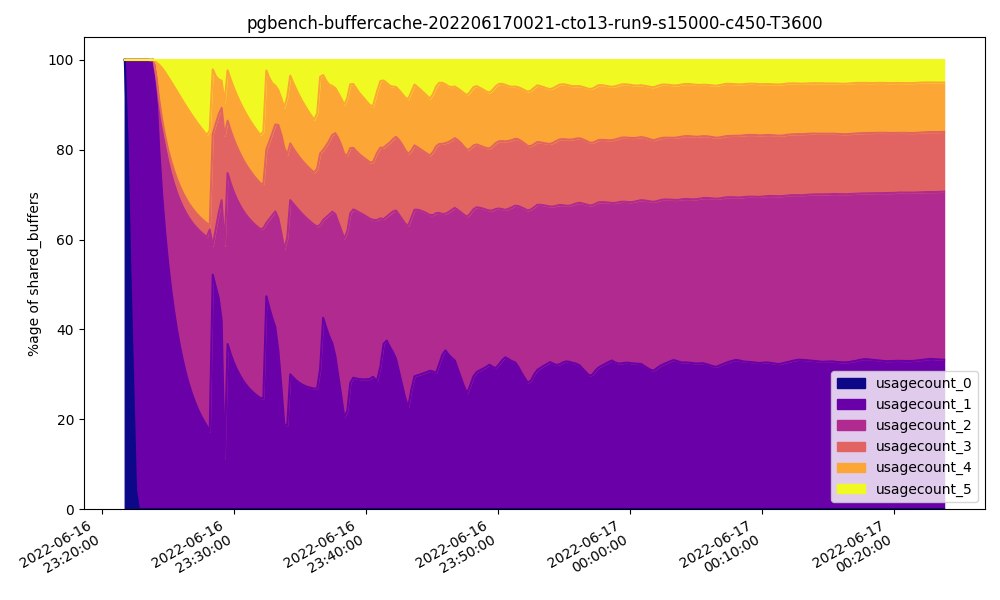
Usage count for these buffers apparently increases since more memory is available, yet overall performance is lower. How could that be?
Part of the issue here is that scanning memory takes time. Postgres regularly scans its Shared Buffers in order to remove infrequently used pages in favor of more recent or regularly accessed pages, and to mark pages for various types of usage before they’re flushed to disk during a checkpoint. These servers are equipped with DDR4 RAM, and even top-of-the-line PC4-3200 modules can only transfer a maximum of about 25GB/s. There’s a point of diminishing returns where it takes longer to scan vast amounts of Shared Buffers than we gain from having readily available data pages.
While not as fast as RAM, the SSDs in this system are handily serving data requests at a rate that is practically indistinguishable from Shared Buffer access. At least in the case of pgbench, SSD random operation throughput makes Shared Buffers irrelevant. Who could have possibly expected this? We all know SSDs are incredibly nimble, but rendering Shared Buffers as practically moot is unprecedented.
A more traditional transaction
Maybe the problem is that pgbench is too artificial of a benchmark. Postgres users and devs alike have made this criticism of the utility. Our last foray gave us HammerDB and its TPROC-C OLTP benchmark as a more representative usage pattern. Maybe that will shed some more light on what exactly is happening here.
Like with the pgbench database, we needed to have a larger volume of data to work with. This time we initialized with 2250 warehouses distributed over 15 schema users for a database size of roughly 215GB. Similarly, we increased the amount of active clients to 450 to make use of the increased CPU thread count. As always, benchmarks ran for one hour. Will things turn out the same way as with pgbench?
Let’s take a look at the New Orders Per Minute (NOPM) results first:
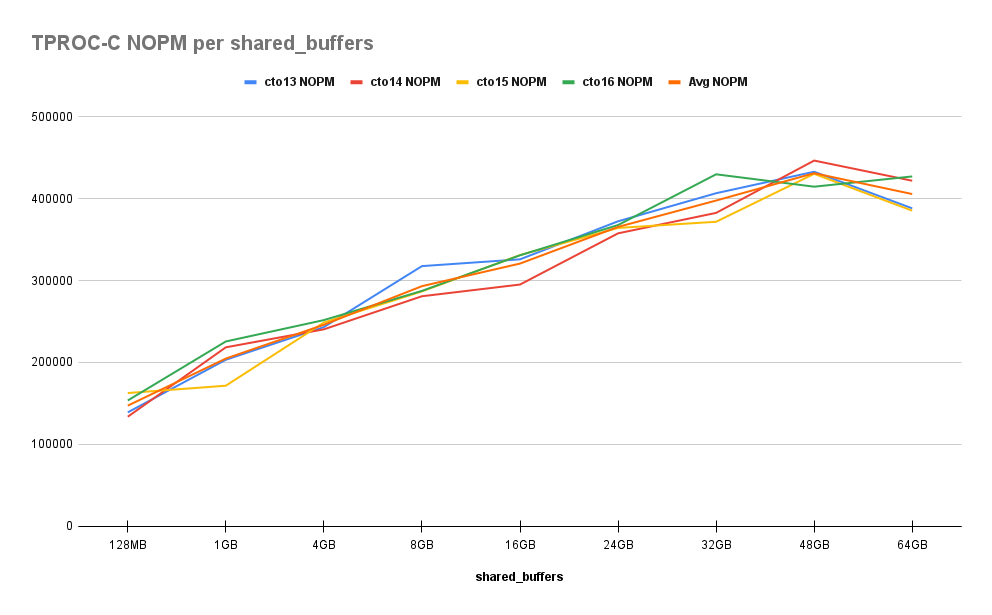
This is a stark contrast with the results from Part One of this series. Rather than a nearly exponential climb as memory increases, performance improvements follow a more modest linear to parabolic curve. This isn’t the 1200% improvement we saw last time, but it’s not quite the flat line we saw with the updated pgbench test either. It’s also easy to forget that the maximum NOPM in this chart is 9x better than numbers collected in Part One !
This behavior is echoed in the Transaction Per Minute (TPM) chart as well:

Unlike with pgbench, there’s a clear benefit to increased Shared Buffers for this type of workload. Performance increases regularly from 128MB to 48GB where we reach nearly 200% over baseline. But there appears to be a fly in the ointment once we reach 64GB and improvement drops to 175% over baseline—a definitive regression.
If we take a look at buffer usage at 48GB, we see this:
This is perhaps a bit “choppier” than ideal circumstances, but usage counts are mostly in the higher end, suggesting these buffers are extremely active. This is exactly what we would expect given the performance improvements at that point.
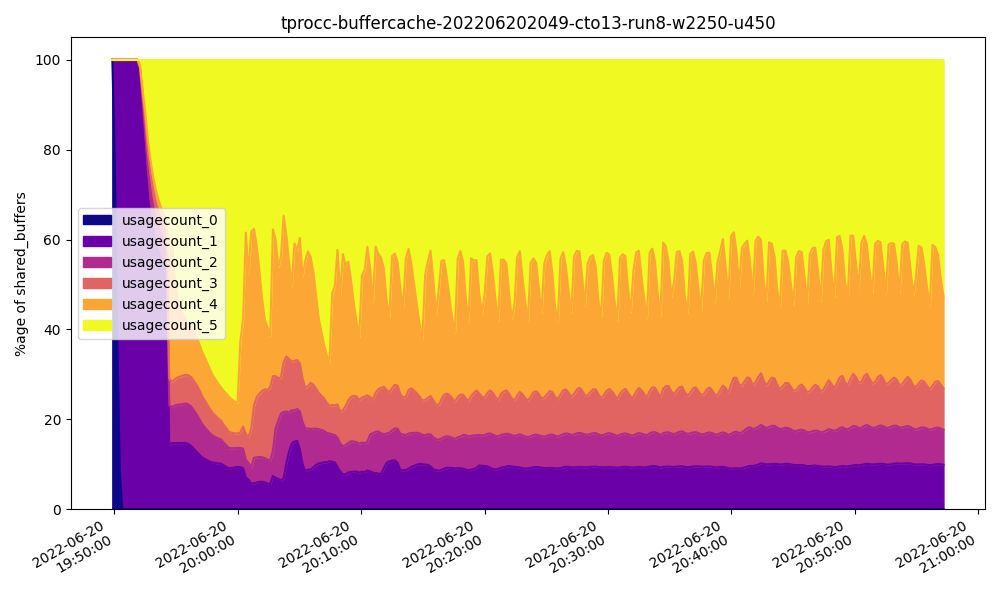
What about the 64GB buffer usage graph?

While there’s a perceptible increase in high count buffer usage, there’s also a dramatic increase in entropy. At what point does maintaining the buffer state result in pathological behavior that harms performance? While we can’t exactly extrapolate this limited data into a definitive formula, there’s certainly a pattern forming now that we have results from two dramatically different benchmarks.
So let’s move on to the third.
Warehouse workload
The last time we tested an OLAP database using HammerDB, each increase in Shared Buffers resulted in incrementally worse performance. Will that still be the case with SSD storage? We predicted it would, and that the Random IO capabilities would flatten the curve somewhat.
As with the other two benchmarks, we increased the database size by advancing the scale factor to 100 over three virtual users. This gave us a 211 GB database for the virtual users to harass with ponderous and lumbering warehouse queries for an hour. How did our prediction go?
Let’s take a look at the geometric mean query run time:
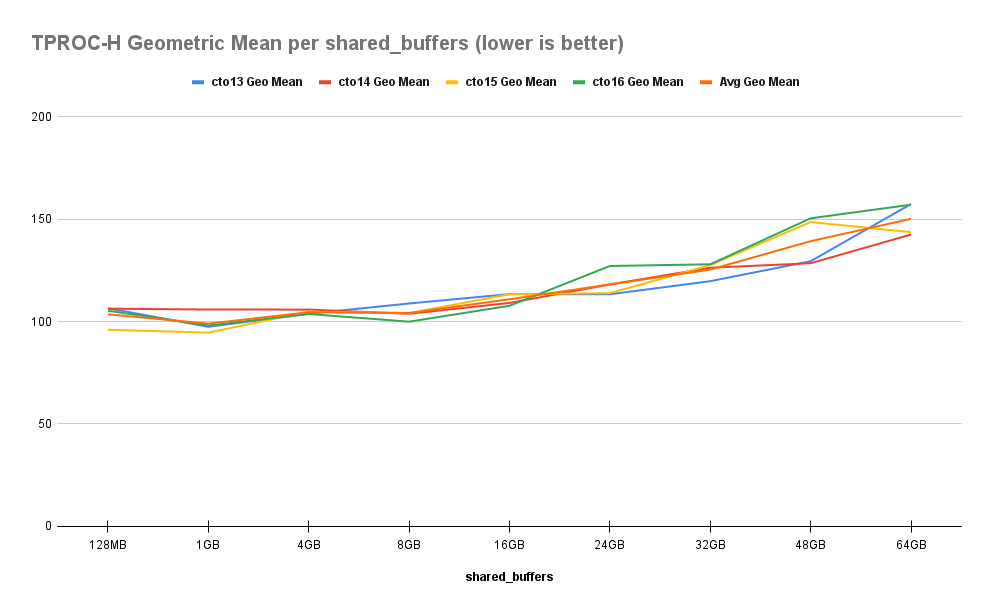
As expected, performance does follow a steady decay as Shared Buffers increase, but it’s a much less dramatic drop than we saw in Part 1. Rather than a 380% decrease from baseline, it’s a more agreeable 45%. The precipitous drop at 16GB has vanished as well, leaving a smooth curve in its wake. Let’s see this a bit more clearly:
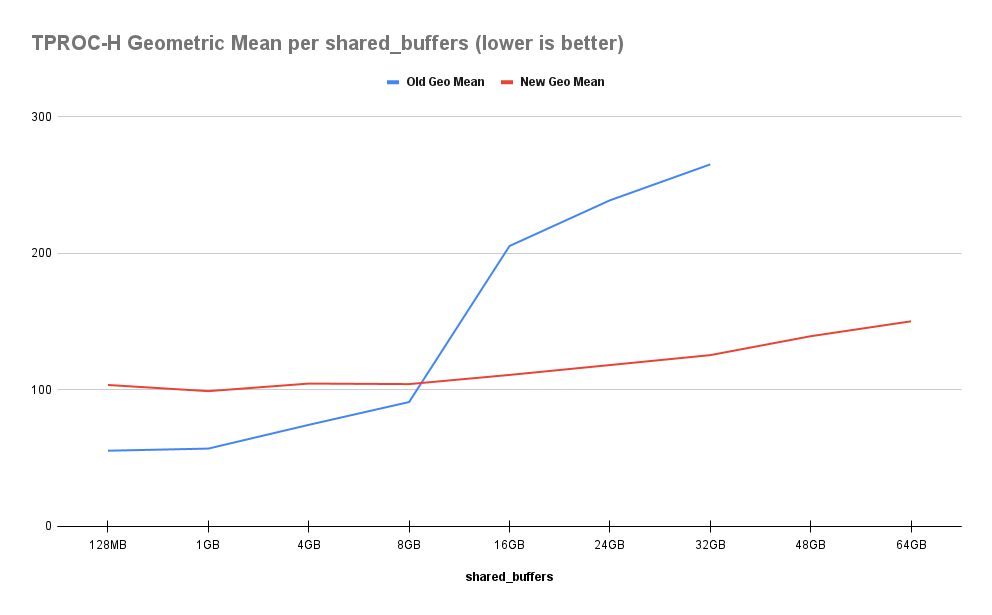
This follows perfectly with our expectations at this point. An OLTP workload still prefers smaller allocations of Shared Buffers due to lower repeated buffer usage counts. Yet at the same time, the faster storage throughput helps negate the impact of reduced memory efficiency. Remember, each GB we dedicate to Postgres Shared Buffers is one fewer GB available for the OS filesystem cache, sorting, joining, or other query purposes. That means more frequent disk reads, and the pgbench results here show near-memory parity for speed.
What it all means
When a server is equipped with high throughput storage, the impact from Shared Buffers is greatly diminished. The maximum improvement we observed from the SSD-equipped systems in all benchmarks was returned by TPROC-C. Thanks to the high buffer usage rates, the TPROC-C tests benefited far more than pgbench did, yet the absolute improvement was a mere 200% rather than 1200% in the HDD equipped servers.
This isn’t to suggest tuning Shared Buffers is pointless! The disparity between these two server configurations is stark, and it’s always a good idea to extract the greatest amount of a server’s capabilities. Rather than the old days where one might expect an order of magnitude improvement in transaction rate by tweaking Shared Buffers, modern servers and application stacks may only see a low multiple or even a modest percentage.
SSDs provide another hidden benefit related to cold cache operation. Consider the case where Postgres or the server itself are ever restarted, or the cluster experiences a failover to a Hot Standby. This essentially causes all requests to operate at the speed of the underlying storage until filesystem caches and Shared Buffers better represent incoming requests.
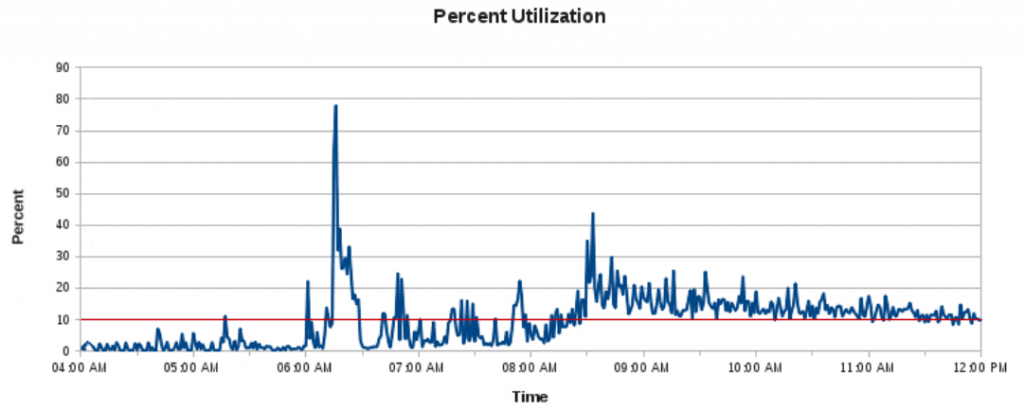
This is the storage bandwidth utilization chart of a financial trading application following such an event back in 2011:
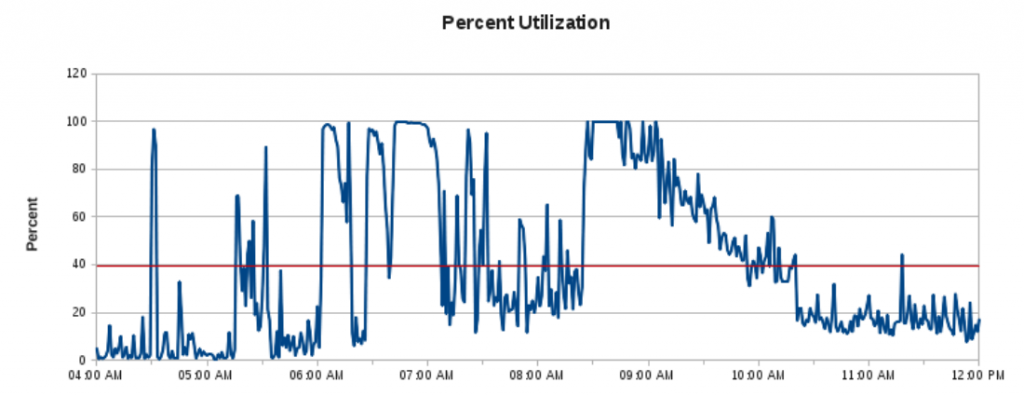
Transaction rates during those 100% peaks were far below normal, resulting in many page timeout events and customer complaints. SSDs were still extremely expensive back then, and many operating systems still hadn’t added the necessary TRIM support to prevent degrading performance over time. The company behind this application purchased a PCIe NVRAM device with custom kernel drivers instead, and this was the result:
Remember that this is from a completely cold cache back in 2011, on a day with a 20% greater transaction volume than the preceding chart. Technology advancements mean commodity storage devices can deliver 100k IOPS or more, once purely the realm of boutique hardware. Even many cloud services can dispense that kind of throughput on demand. High rate devices or IOPS guarantees are still comparatively expensive, but storage technology improvements will continue to drive costs down. As that happens, Shared Buffers adopts an increasingly vestigial role.
Given all of that, we can follow a few “new” rules of thumb in the modern era when configuring Shared Buffers:
- OLAP warehouse-oriented servers can operate normally with the default of 128MB.
- Continue to follow the 25% rule for OLTP systems.
- Exercise caution when exceeding 32GB of RAM.
- Never exceed 64GB of RAM.
Given our TPROC-H benchmark results, the first rule should be obvious enough. The second rule reflects the fact that our active data is likely a large proportion of the overall set. If application usage revisits this data often, it’s best retained in Shared Buffers rather than relying on filesystem caches or even high throughput storage.
The corollaries to the second rule account for the point of diminishing returns, where the expense of adding more Shared Buffers is greater than the returned performance. The transaction rate in our TPROC-C benchmark only improved by 8% from 32GB to 48GB allocated to Shared Buffers, a 50% increase in RAM. Some companies may find this an acceptable rate of return, but care must be taken beyond this.
Performance in our tests began to decline at 64GB, which could be related to reaching 50% of total server RAM and associated NUMA locality effects, data transfer limitations inherent to DDR4 RAM, or some other combination of operating system or hardware behavior. As a result, we can’t really determine whether or not hardware equipped with more RAM will suffer from the same effects measured here. There’s no substitution for performing your own tests on proposed hardware configurations.
In a wondrous future replete with breakneck storage performance, there’s no reason to risk memory starvation in the first place. Shared Buffers still plays a role in server optimization, but it’s no longer the make-it-or-break-it parameter we once knew. Indeed, perhaps we should focus more on the role of max_wal_size in reducing checkpoint overhead