Two serious security vulnerabilities (code named Meltdown and Spectre) were revealed a couple of weeks ago. Initial tests suggested the performance impact of mitigations (added in the kernel) might be up to ~30% for some workloads, depending on the syscall rate.
Those early estimates had to be done quickly, and so were based on limited amounts of testing. Furthermore, the in-kernel fixes evolved and improved over time, and we now also got retpoline which should address Spectre v2. This post presents data from more thorough tests, hopefully providing more reliable estimates for typical PostgreSQL workloads.
Compared to the early assessment of Meltdown fixes which Simon posted back on January 10, data presented in this post are more detailed but in general match findings presented in that post.
This post is focused on PostgreSQL workloads, and while it may be useful for other systems with high syscall/context switch rates, it certainly is not somehow universally applicable. If you are interested in a more general explanation of the vulnerabilities and impact assessment, Brendan Gregg published an excellent KPTI/KAISER Meltdown Initial Performance Regressions article a couple of days ago. Actually, it might be useful to read it first and then continue with this post.
Note: This post is not meant to discourage you from installing the fixes, but to give you some idea what the performance impact may be. You should install all the fixes so that your environment it secure, and use this post to to decide if you may need to upgrade hardware etc.
What tests will we do?
We will look at two usual basic workload types – OLTP (small simple transactions) and OLAP (complex queries processing large amounts of data). Most PostgreSQL systems can be modeled as a mix of these two workload types.
For OLTP we used pgbench, a well-known benchmarking tool provided with PostgreSQL. We tested both in read-only (-S) and read-write (-N) modes, with three different scales – fitting into shared_buffers, into RAM and larger than RAM.
For the OLAP case, we used dbt-3 benchmark, which is fairly close to TPC-H, with two different data sizes – 10GB that fits into RAM, and 50GB which is larger than RAM (considering indexes etc.).
All the presented numbers come from a server with 2x Xeon E5-2620v4, 64GB of RAM and Intel SSD 750 (400GB). The system was running Gentoo with kernel 4.15.3, compiled with GCC 7.3 (needed to enable the full retpoline fix). The same tests were performed also on an older/smaller system with i5-2500k CPU, 8GB of RAM and 6x Intel S3700 SSD (in RAID-0). But the behavior and conclusions are pretty much the same, so we’re not going to present the data here.
As usuall, complete scripts/results for both systems are available at github.
This post is about performance impact of the mitigation, so let’s not focus on absolute numbers and instead look at performance relative to unpatched system (without the kernel mitigations). All charts in the OLTP section show
(throughput with patches) / (throughput without patches)We expect numbers between 0% and 100%, with higher values being better (lower impact of mitigations), 100% meaning “no impact.”
Note: The y-axis starts at 75%, to make the differences more visible.
OLTP / read-only
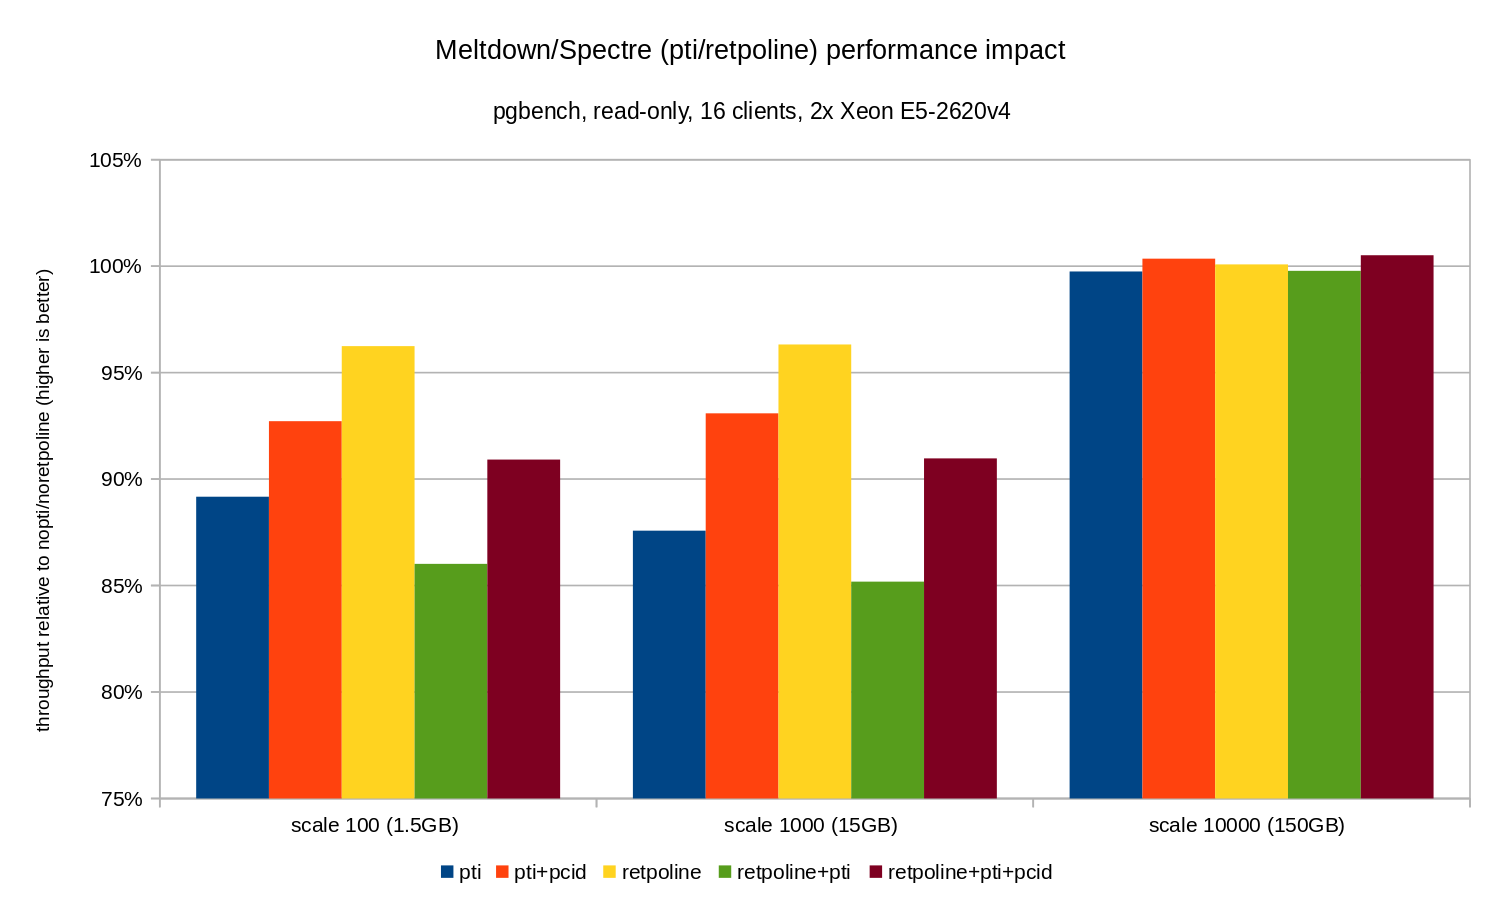
First, let’s see results for read-only pgbench, executed by this command
pgbench -n -c 16 -j 16 -S -T 1800 testand illustrated by the following chart:

As you can see, the performance impact of pti for scales that fit into memory is roughly 10-12% and almost non-measurable when the workload becomes I/O bound. Furthermore, the regression is significantly reduced (or disappears entirely) when pcid is enabled. This is is consistent with the claim that PCID is now a critical performance/security feature on x86. The impact of retpoline is much smaller – less than 4% in the worst case, which may easily be due to noise.
OLTP / read-write
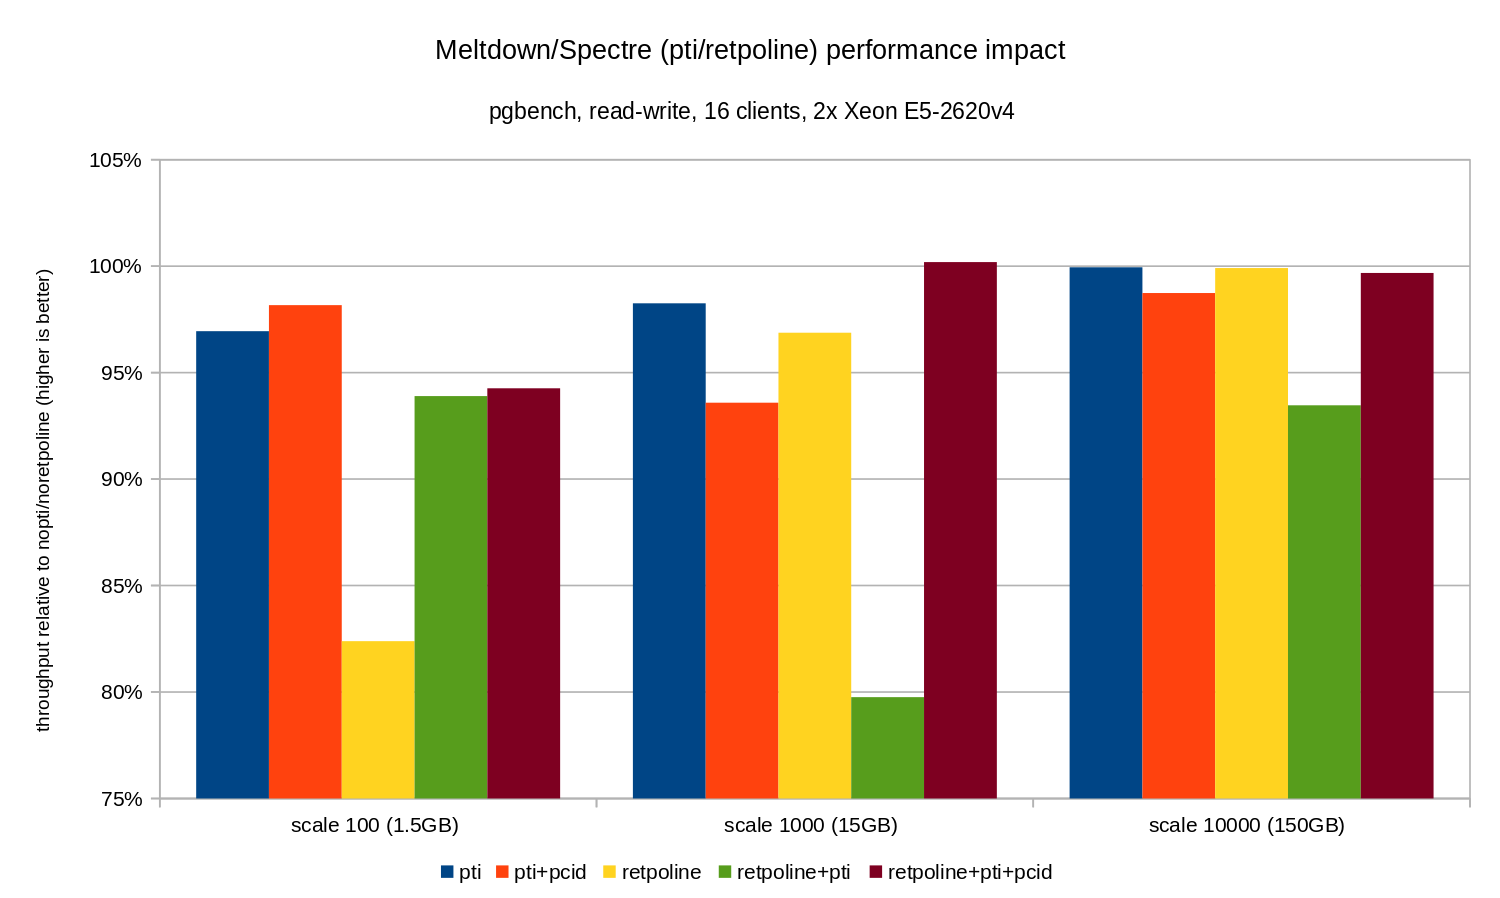
The read-write tests were performed by a pgbench command similar to this one:
pgbench -n -c 16 -j 16 -N -T 3600 testThe duration was long enough to cover multiple checkpoints, and -N was used to eliminate lock contention on rows in the (tiny) branch table. The relative performance is illustrated by this chart:

The regressions are a bit smaller than in the read-only case – less than 8% without pcid and less than 3% with pcid enabled. This is a natural consequence of spending more time performing I/O while writing data to WAL, flushing modified buffers during checkpoint etc.
There are two strange bits, though. Firstly, the impact of retpoline is unexpectedly large (close to 20%) for scale 100, and the same thing happened for retpoline+pti on scale 1000. The reasons are not quite clear and will require additional investigation.
OLAP
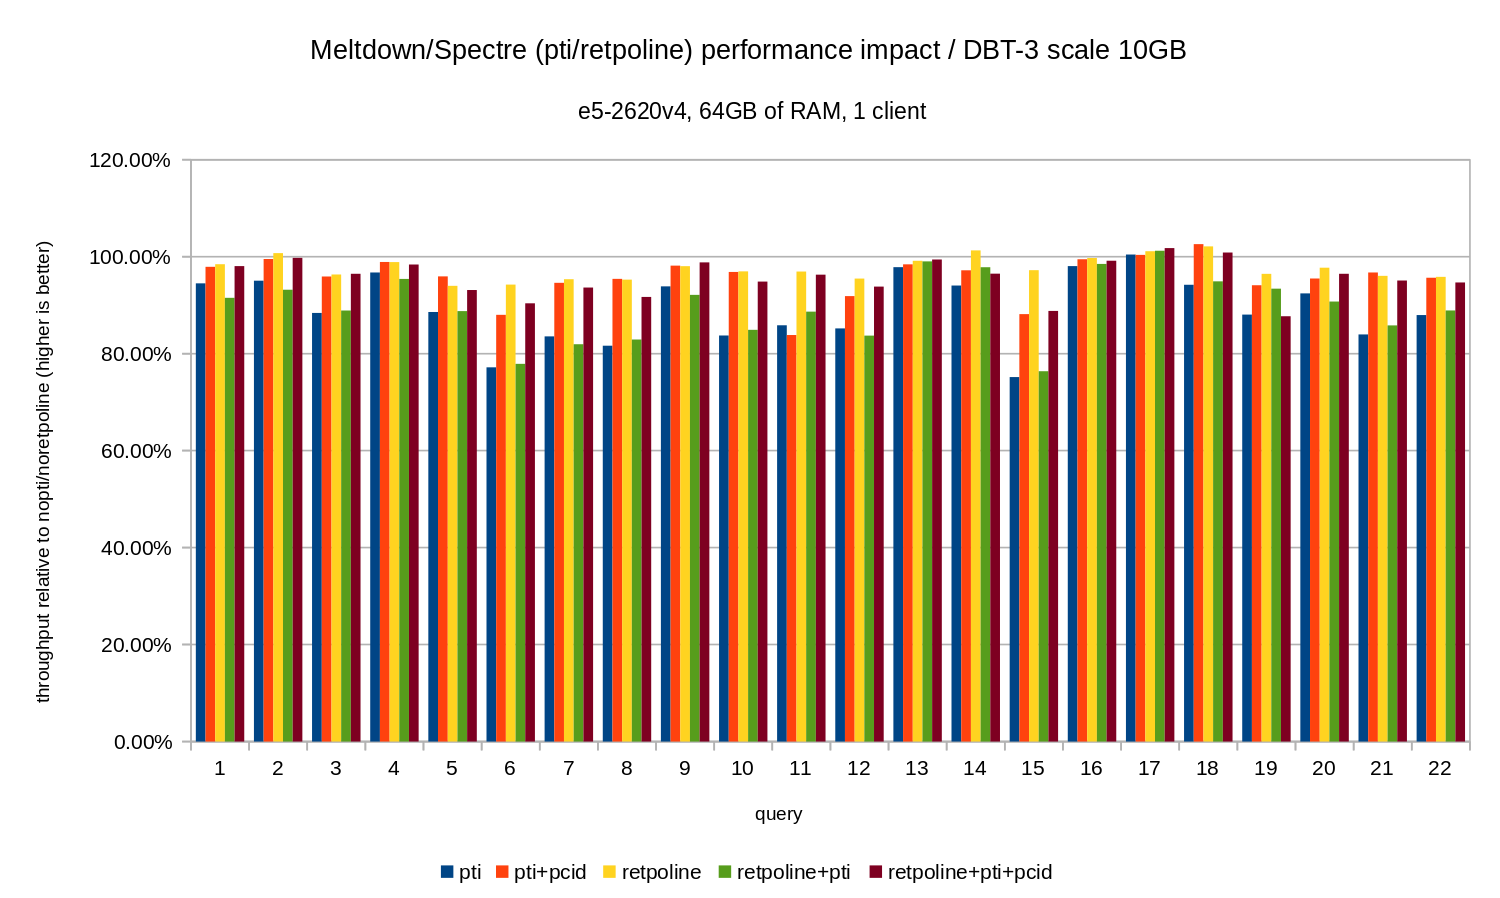
The analytics workload was modeled by the dbt-3 benchmark. First, let’s look at scale 10GB results, which fits into RAM entirely (including all the indexes etc.). Similarly to OLTP we’re not really interested in absolute numbers, which in this case would be duration for individual queries. Instead we’ll look at slowdown compared to the nopti/noretpoline, that is:
(duration without patches) / (duration with patches)Assuming the mitigations result in slowdown, we’ll get values between 0% and 100% where 100% means “no impact”. The results look like this:

That is, without the pcid the regression is generally in the 10-20% range, depending on the query. And with pcid the regression drops to less than 5% (and generally close to 0%). Once again, this confirms the importance of pcid feature.
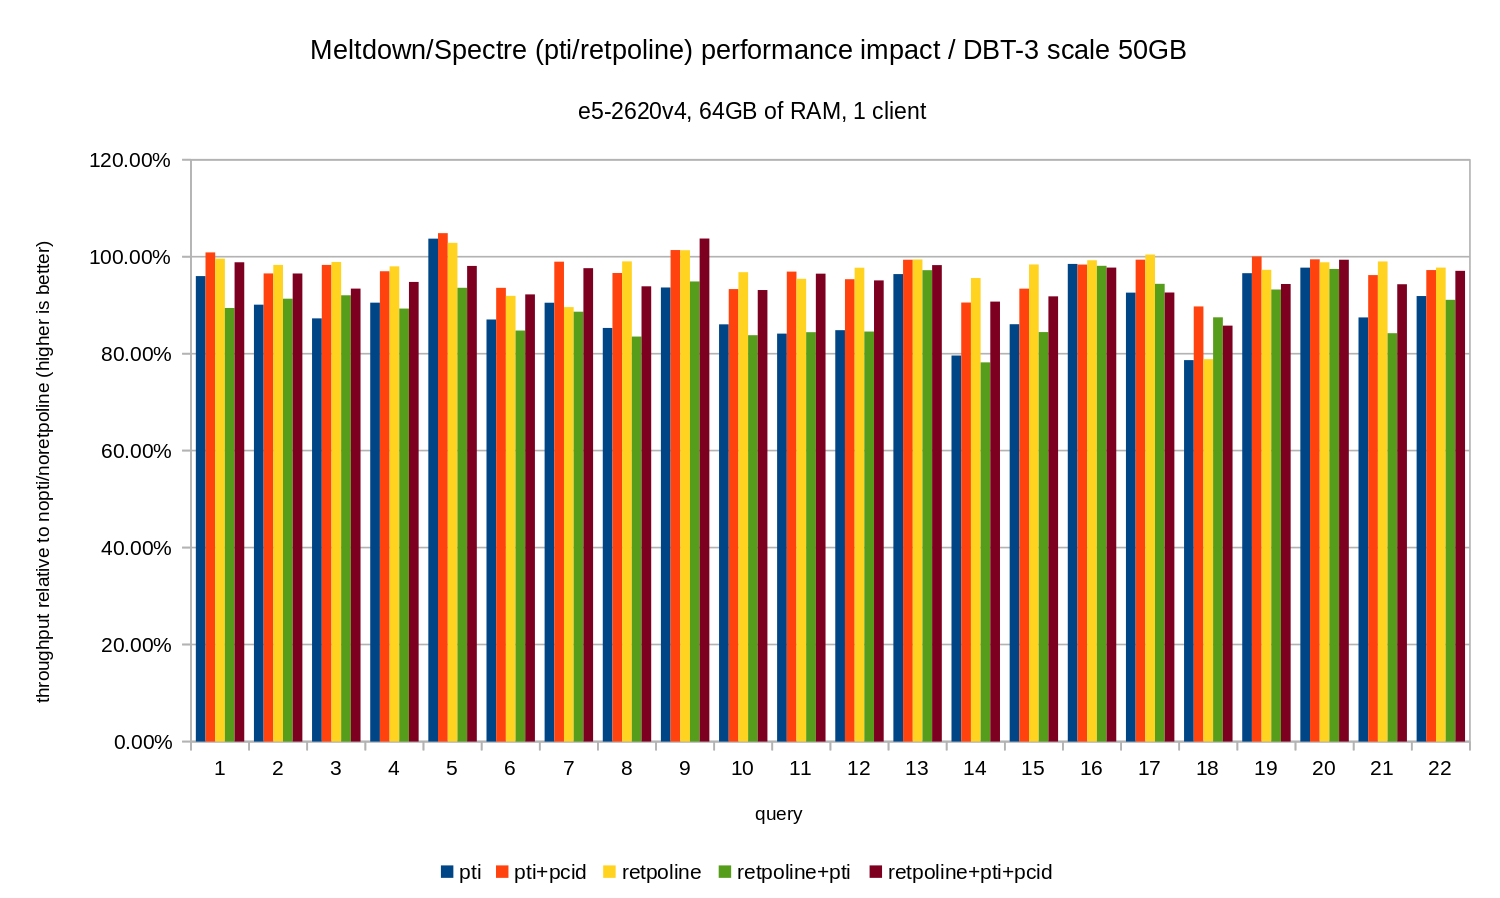
For the 50GB data set (which is about 120GB with all the indexes etc.) the impact look like this:

So just like in the 10GB case, the regressions are below 20% and pcid significantly reduces them – close to 0% in most cases.
The previous charts are a bit cluttered – there are 22 queries and 5 data series, which is a bit too much for a single chart. So here is a chart showing the impact only for all three features (pti, pcid and retpoline), for both data set sizes.

Conclusion
To briefly summarize the results:
retpolinehas very little performance impact- OLTP – the regression is roughly 10-15% without the
pcid, and about 1-5% withpcid. - OLAP – the regression is up to 20% without the
pcid, and about 1-5% withpcid. - For I/O bound workloads (e.g. OLTP with the largest dataset), Meltdown has negligible impact.
The impact seems to be much lower than initial estimates suggesting (30%), at least for the tested workloads. Many systems are operating at 70-80% CPU at peak periods, and the 30% would fully saturate the CPU capacity. But in practice the impact seems to be below 5%, at least when the pcid option is used.
Don’t get me wrong, 5% drop is still a serious regression. It certainly is something we would care about during PostgreSQL development, e.g. when evaluating impact of proposed patches. But it’s something existing systems should handle just fine – if 5% increase in CPU utilization gets your system over the egde, you have issues even without Meltdown/Spectre.
Clearly, this is not the end of Meltdown/Spectre fixes. Kernel developers are still working on improving the protections and adding new ones, and Intel and other CPU manufacturers are working on microcode updates. And it’s not like we know about all possible variants of the vulnerabilities, as researchers managed to find new variants of the attacks.
So there’s more to come and it will be interesting to see what the impact on performance will be.
