Tools for Monitoring Postgres Databases

Users depend on databases to carry out meaningful work. Whether it’s connected to a mission-critical application or helping a single user carry out a very specific task, databases must be well-maintained in order to provide high performance. Proactively monitoring databases is one of the best ways to ensure a smooth long-term operation with minimal downtime and predictable costs.
The Benefits of Database Monitoring
Database monitoring offers several high-level and low-level benefits. Among the low-level benefits, database monitoring allows for better time and resource utilization. By monitoring disk space, for instance, you can see when an application begins to require more disk space and incorporate those needs into future capacity planning. For mission-critical applications, backups can be monitored to ensure they are available and concurrent, and checked for any types of latency issues when running on standby. From a performance perspective, database monitoring can also tell application developers whether queries are being resolved in seconds or milliseconds as opposed to multiple seconds.
The high-level benefits of database monitoring help deliver the ultimate goal — a better user experience. A high-performing database plays a fundamental role in releasing better products to market. Database monitoring also makes it possible to manage costs — not necessarily to save money, but to anticipate overall spending and budget accordingly. Finally, database monitoring can identify issues as they come up to avoid work stoppages and downtime.
Layers of Database Monitoring
There are three layers of database monitoring:
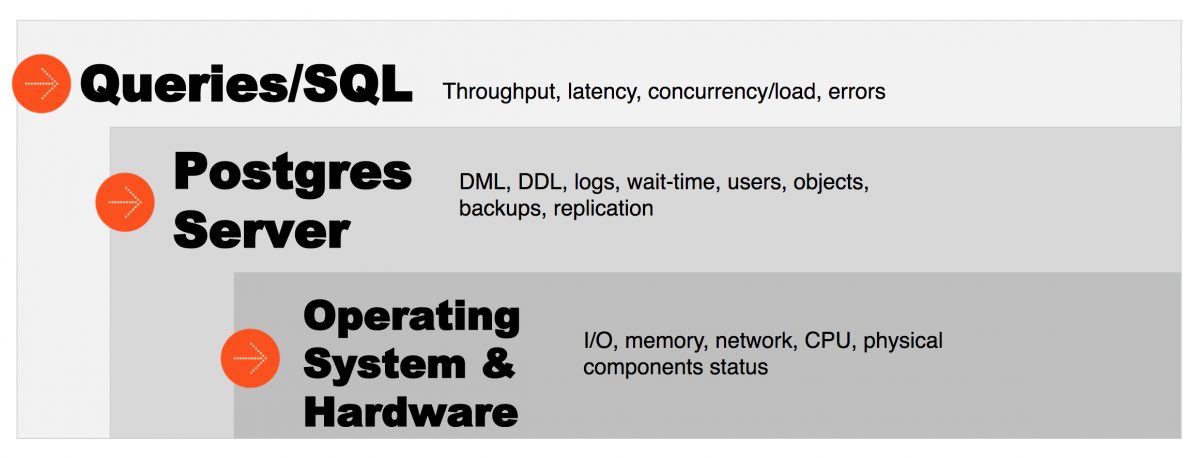
- The operating system and the hardware, looking at areas like input, output, memory utilization, network utilization, CPU, physical disk space, and component status.
- The Postgres server software, to examine DML & DDL statements in logs, wait time, users, objects, whether backups ran successfully, and whether replication is running.
- Individual SQL statements or queries, to examine throughput, latency, concurrency/load, and how errors are being dealt with.
Who Benefits from Monitoring Databases?
Database monitoring can benefit developers, database administrators (DBAs), and Operations. If you are a developer, your focus will be on application development. A monitoring tool can help identify slow running queries that are negatively impacting the user experience. If you are a DBA, sometimes called a site reliability engineer or database reliability engineer, your focus will be on database administration. A monitoring tool should be able to manage users, backups, tables/objects, and help tune the database to optimize performance. If you are in Operations, your focus will be on Day 2 activities, such as maintenance and planning. Monitoring would help identify which servers need to be patched or upgraded and forecast hardware or infrastructure changes.
Types of Database Monitoring Tools
Many different database monitoring tools exist, and the best solution depends entirely on an organization’s needs. Broadly speaking, these tools break down into four categories:
- Health checks and alerting
- Optimizing query performance
- Administration or reporting
- General purpose monitoring
Health Checks and Alerting
Health checks and alerting are among the most critical database monitoring functions, and one of the most common tools used in the field today is Nagios. Nagios has several plugins that execute quick status checks, essentially running a script you can write to get a response that says whether something is okay, warning, or critical. Postgres Enterprise Manager®️ (PEM) offers health check capabilities and alerts, and has a Nagios plugin that can be configured to send passive alerts to a Nagios instance. Other tools in this category are Zabbix, which incorporates general purpose monitoring with graphing and charting, and Datadog, which began as a core infrastructure monitoring tool and has since expanded into a general purpose monitoring tool.
Query Performance
Query performance monitoring is important for optimizing queries/SQL statements and the broader user experience associated with an application. Understanding the totality of the different types of requests that users and applications are sending to the database, such as background activity, vacuuming, and backups, adds up to the resulting performance of the database. Tools like VividCortex are useful for proactively diagnosing performance problems. EDB Postgres Enterprise Manager has a SQL Profiler which can diagnose slow running queries. Pganalyze can surface historical statistics from an internal PostgreSQL table’s pg_stat_statements on query performance. PgBadger, an open source tool, analyzes log files and is considered lightweight for enterprise needs.
Reporting and Administration
Reporting and administration tools focus on the needs of database administrators or Operations teams, who need to report on database activity or manipulate databases. Needs can vary widely, such as trying to develop a specific report or make administrative changes that can result in adding users, data types, or modifying objects like tables, stored procedures, schema and indexes. These tools allow for adhoc interactions, like querying the database, to run a report or edit the data directly in a table. Tools in this category are pgAdmin, EDB Postgres Enterprise Manager (built on pgAdmin), DBeaver, Adminer and PostgreSQL clients.
General Purpose Monitoring
Finally, general purpose monitoring tools offer a little bit of everything. Datadog, Wavefront, SignalFX, and Prometheus with Grafana include many of these capabilities. These tools are monitoring a wide range of components: servers, databases, services, tools, and sometimes networking. These tools typically scrape status metrics from the server and store them in a time series database for charting and trending. They often have the ability to send alerts based on thresholds and shine when you want to use one tool to monitor as many things as possible.
Monitoring for Maximum Performance
No matter what tools are employed, a strategy to monitor Postgres is essential to keeping the database running like a well-oiled machine. There is no one tool that is the best fit for every organization; instead, it’s best to understand where your needs are on the spectrum of alerting, query performance, administration, or general visibility, and use those criteria to guide your selection. With the right set of Postgres monitoring tools matched to your organization, you can ensure that your database is delivering quality performance around-the-clock.