In the first part of this blog series, I’ve presented a couple of benchmark results showing how PostgreSQL OLTP performance changed since 8.3, released in 2008. In this part I plan to do the same thing but for analytical / BI queries, processing large amounts of data.
There’s a number of industry benchmarks for testing this workload, but probably the most commonly used one is TPC-H, so that’s what I’ll use for this blog post. There’s also TPC-DS, another TPC benchmark for testing decision support systems, which may be seen as an evolution or replacement of TPC-H. I’ve decided to stick to TPC-H for a couple of reasons.
Firstly, TPC-DS is much more complex, both in terms of schema (more tables) and number of queries (22 vs. 99). Tuning this properly, particularly when dealing with multiple PostgreSQL versions, would be much harder. Secondly, some of the TPC-DS queries use features that are not supported by older PostgreSQL versions (e.g. grouping sets), making those queries irrelevant for some versions. And finally, I’d say people are much more familiar with TPC-H compared to TPC-DS.
The goal of this is not to allow comparison to other database products, only to provide a reasonable long-term characterization on how PostgreSQL performance evolved since PostgreSQL 8.3.
Note: For a very interesting analysis of TPC-H benchmark, I strongly recommend the “TPC-H Analyzed: Hidden Messages and Lessons Learned from an Influential Benchmark” paper from Boncz, Neumann and Erling.
The hardware
Most of the results in this blog post come from the “bigger box” I have in our office, which has these parameters:
- 2x E5-2620 v4 (16 cores, 32 threads)
- 64GB RAM
- Intel Optane 900P 280GB NVMe SSD (data)
- 3 x 7.2k SATA RAID0 (temporary tablespace)
- kernel 5.6.15, ext4 filesystem
I’m sure you can buy significantly beefier machines, but I believe this is good enough to give us relevant data. There were two configuration variants – one with parallelism disabled, one with parallelism enabled. Most of the parameter values are the same in both cases, tuned to available hardware resources (CPU, RAM, storage). You can find a more detailed information about the configuration at the end of this post.
The benchmark
I want to make it very clear that it’s not my goal to implement a valid TPC-H benchmark that could pass all the criteria required by the TPC. My goal is to evaluate how the performance of different analytical queries changed over time, not chase some abstract measure of performance per dollar or something like that.
So I’ve decided to only use a subset of TPC-H – essentially just load the data, and run the 22 queries (same parameters on all versions). There are no data refreshes, the data set is static after the initial load. I’ve picked a number of scale factors, 1, 10 and 75, so that we have results for fits-in-shared-buffers (1), fits-in-memory (10) and more-than-memory (75). I’d go for 100 to make it a “nice sequence”, that wouldn’t fit into the 280GB storage in some cases (thanks to indexes, temporary files, etc.). Note that scale factor 75 is not even recognized by TPC-H as a valid scale factor.
But does it even make sense to benchmark 1GB or 10GB data sets? People tend to focus on much larger databases, so it might seem a bit foolish to bother with testing those. But I don’t think that’d be useful – the vast majority of databases in the wild is fairly small, in my experience And even when the whole database is large, people usually only work with a small subset of it – recent data, unresolved orders, etc. So I believe it makes sense to test even with those small data sets.
Data loads
First, let’s see how long it takes to load data into the database – without and with parallelism. I’ll only show results from the 75GB data set, because the overall behavior is almost the same for the smaller cases.
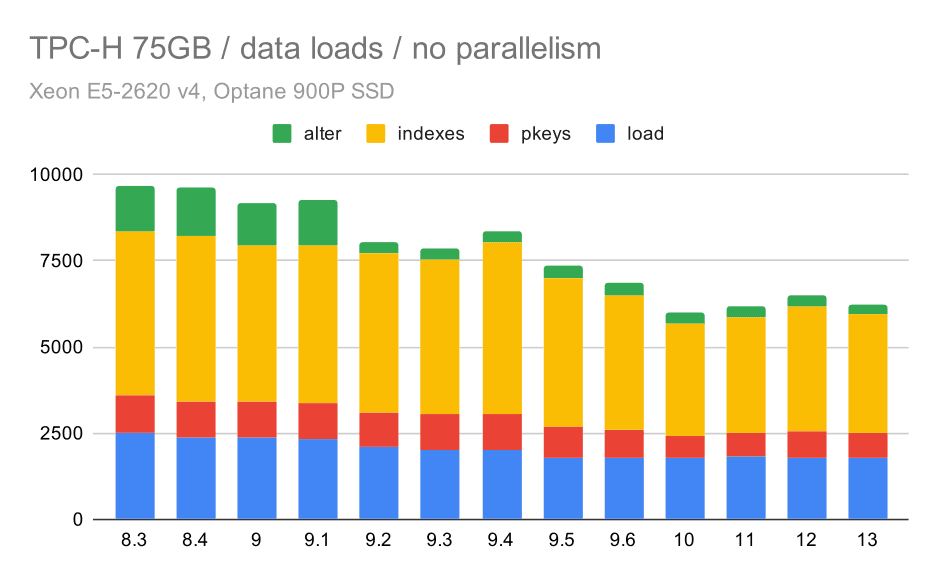
TPC-H data load duration – scale 75GB, no parallelism
You can clearly see there’s a steady trend of improvements, shaving off about 30% of the duration merely by improving efficiency in all four steps – COPY, creating primary keys and indexes, and (especially) setting up foreign keys. The “alter” improvement in 9.2 is particularly clear.
| COPY | PKEYS | INDEXES | ALTER | |
| 8.3 | 2531 | 1156 | 1922 | 1615 |
| 8.4 | 2374 | 1171 | 1891 | 1370 |
| 9.0 | 2374 | 1137 | 1797 | 1282 |
| 9.1 | 2376 | 1118 | 1807 | 1268 |
| 9.2 | 2104 | 1120 | 1833 | 1157 |
| 9.3 | 2008 | 1089 | 1836 | 1229 |
| 9.4 | 1990 | 1168 | 1818 | 1197 |
| 9.5 | 1982 | 1000 | 1903 | 1203 |
| 9.6 | 1779 | 872 | 1797 | 1174 |
| 10 | 1773 | 777 | 1469 | 1012 |
| 11 | 1807 | 762 | 1492 | 758 |
| 12 | 1760 | 768 | 1513 | 741 |
| 13 | 1782 | 836 | 1587 | 675 |
Now, let’s see how enabling parallelism changes the behavior. The following chart compares results with parallelism enabled – marked with “(p)” – to results with parallelism disabled.
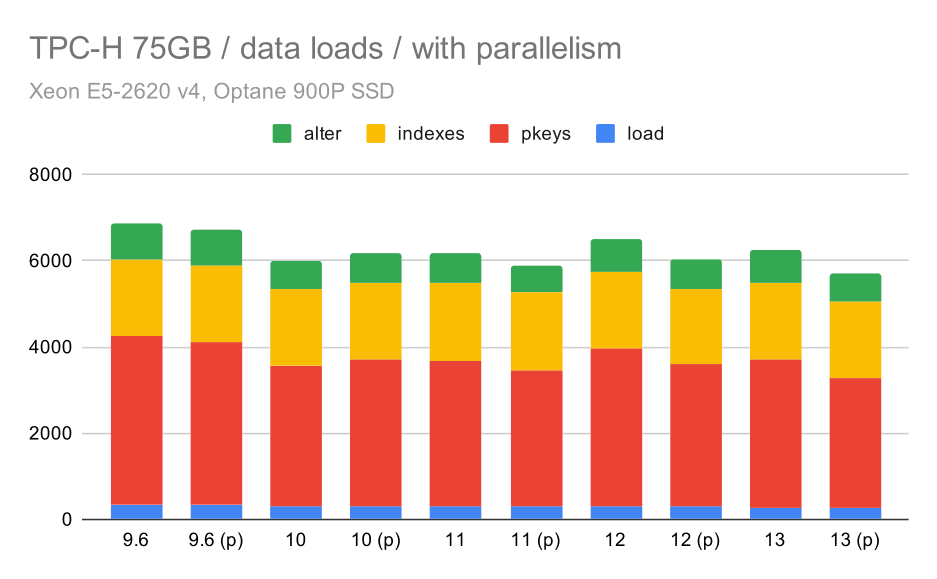
TPC-H data load duration – scale 75GB, parallelism enabled.
Unfortunately, it seems the effect of parallelism is very limited in this test – it does help a bit, but the differences are fairly small. So the overall improvement remains about 30%.
| COPY | PKEYS | INDEXES | ALTER | |
| 9.6 | 344 | 3902 | 1786 | 831 |
| 9.6 (p) | 346 | 3781 | 1780 | 832 |
| 10 | 318 | 3259 | 1766 | 671 |
| 10 (p) | 315 | 3400 | 1769 | 693 |
| 11 | 319 | 3357 | 1817 | 690 |
| 11 (p) | 320 | 3144 | 1791 | 618 |
| 12 | 314 | 3643 | 1803 | 754 |
| 12 (p) | 313 | 3296 | 1752 | 657 |
| 13 | 276 | 3437 | 1790 | 744 |
| 13 (P) | 274 | 3011 | 1770 | 641 |
Queries
Now we can take a look at queries. TPC-H has 22 query templates – I’ve generated one set of actual queries, and ran them on all versions twice – first after dropping all caches and restarting the instance, then with the warmed-up cache. All of the numbers presented in the charts are the best of these two runs (in most cases it’s the second one, of course).
No parallelism
Without parallelism, the results on the smallest data set are pretty clear – each bar is split into multiple parts with different colors for each of the 22 queries. It’s hard to say which part maps to which exact query, but it’s sufficient for identifying cases when one query improves or gets much worse between two runs. For example in the first chart it’s very clear Q21 got much faster between 8.3 and 8.4.
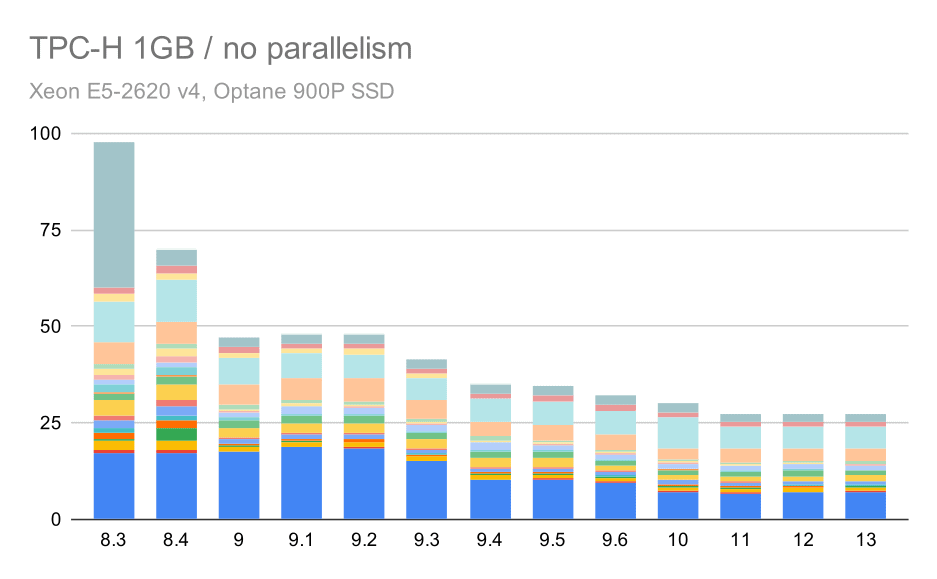
TPC-H queries on small data set (1GB) – parallelism disabled
For the 10GB scale, the results are somewhat hard to interpret, because on 8.3 one of the queries (Q21) takes so much time to execute that it dwarfs everything else.
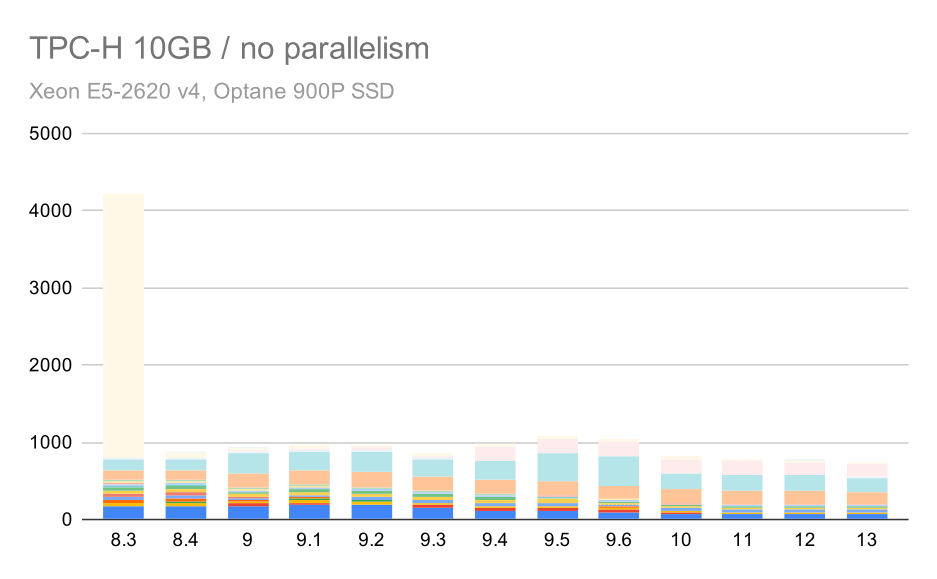
TPC-H queries on medium data set (10GB) – parallelism disabled
So let’s see how would the chart look without Q21:
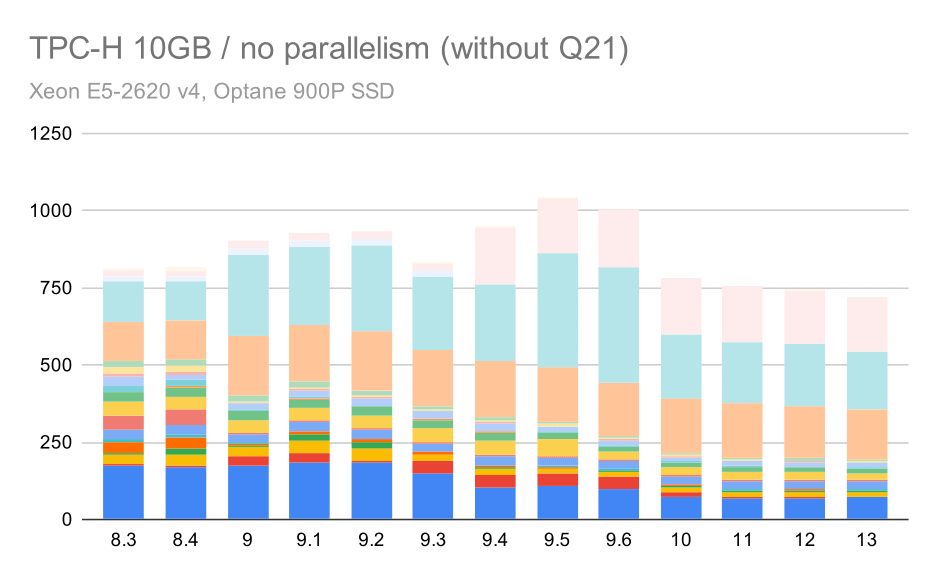
TPC-H queries on medium data set (10GB) – parallelism disabled, without problematic Q2
OK, that’s easier to read. We can clearly see that most of the queries (up to Q17) got faster, but then two of the queries (Q18 and Q20) got somewhat slower. We will see a similar issue on the largest data set, so I’ll discuss what might be the root cause then.
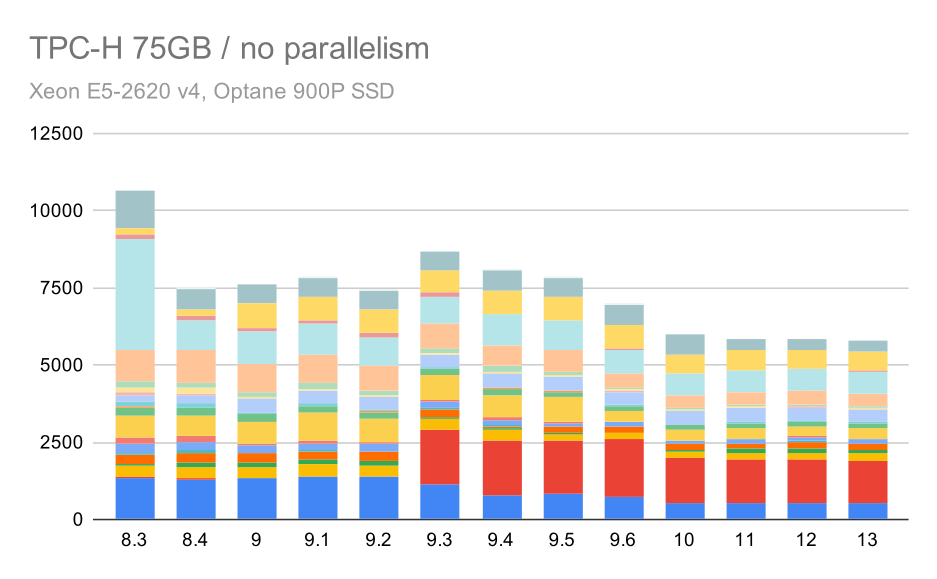
TPC-H queries on large data set (75GB) – parallelism disabled
Again, we see a sudden increase for one of the queries in 9.3 – this time it’s Q2, without which the chart looks like this:
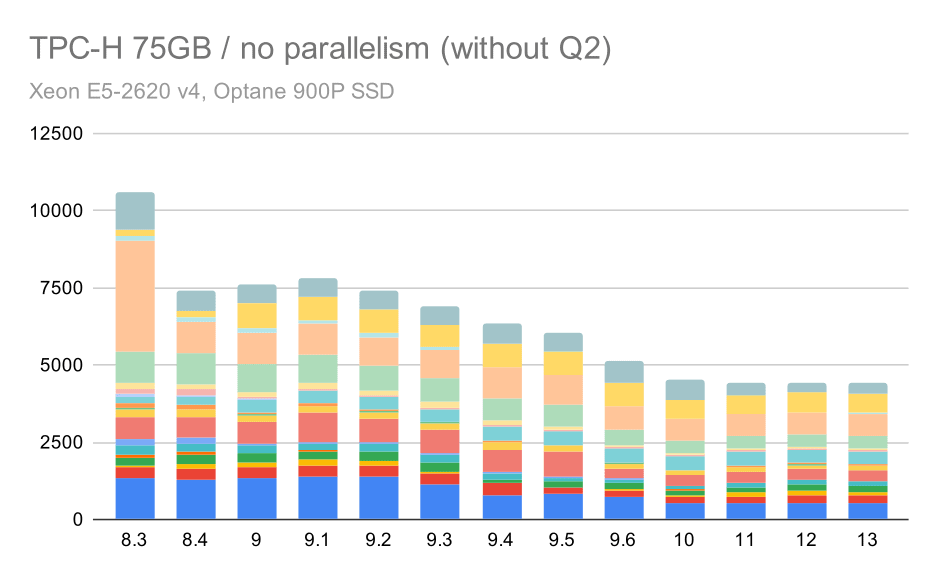
TPC-H queries on large data set (75GB) – parallelism disabled, without problematic Q2
That’s a pretty nice improvement in general, speeding up the whole execution from ~2.7 hours to only ~1.2h, merely by making the planner and optimizer smarter, and by making the executor more efficient (remember, the parallelism was disabled in these runs).
So, what could be the problem with Q2, making it slower in 9.3? The simple answer is that every time you make the planner and optimizer smarter – either by constructing new types of paths / plans, or by making it dependent on some statistics, it also means new mistakes can be made when the statistics or estimates are wrong. In Q2, the WHERE clause references an aggregate subquery – a simplified version of the query might look like this:
select
    1
from
    partsupp
where ps_supplycost = (
        select
            min(ps_supplycost)
        from
            partsupp,
            supplier,
            nation,
            region
        where
            p_partkey = ps_partkey
            and s_suppkey = ps_suppkey
            and s_nationkey = n_nationkey
            and n_regionkey = r_regionkey
            and r_name = 'AMERICA'
    );
The problem is that we don’t know the average value at planning time, making it impossible to compute sufficiently good estimates for the WHERE condition. The actual Q2 contains additional joins, and planning those fundamentally depends on good estimates of the joined relations. In older versions the optimizer seems to have been doing the right thing, but then in 9.3 we made it smarter in some way, but with the poor estimate it fails to make the right decision. In other words, the good plans in older versions were just luck, thanks to the planner limitations.
I’d bet the regressions of Q18 and Q20 on the smaller data set are also caused by something similar, although I haven’t investigated those in detail.
I believe some of those optimizer issues might be fixed by tuning the cost parameters (e.g. random_page_cost etc.) but I haven’t tried that because of time constraints. It does however show that upgrades don’t automatically improve all queries – sometimes an upgrade may trigger a regression, so appropriate testing of your application is a good idea.
Parallelism
So let’s see how much query parallelism changes the results. Again, we’ll only look at results from releases since 9.6 labeling results with “(p)” where parallel query is enabled.
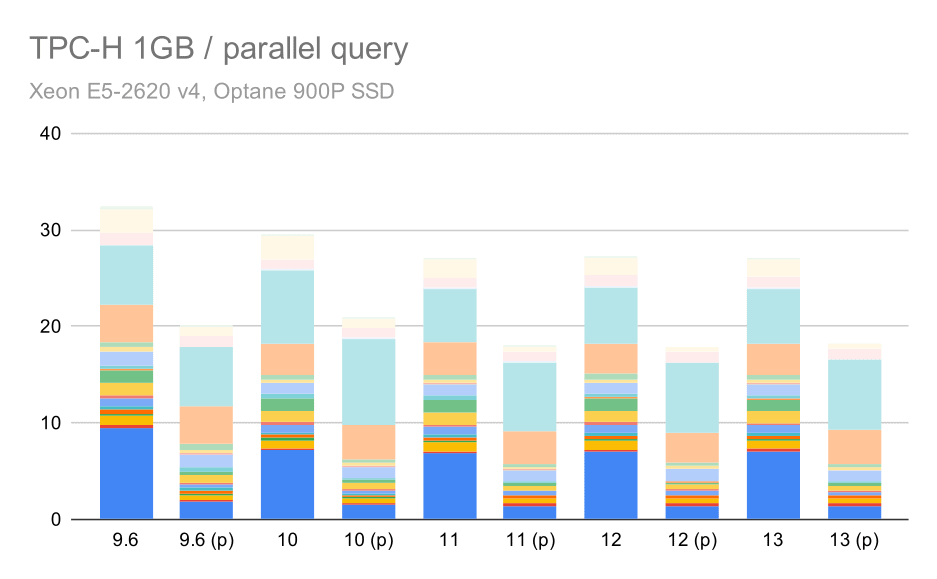
TPC-H queries on small data set (1GB) – parallelism enabled
Clearly, parallelism helps quite a bit – it shaves off about 30% even on this small data set. On the medium data set, there’s not much difference between regular and parallel runs:
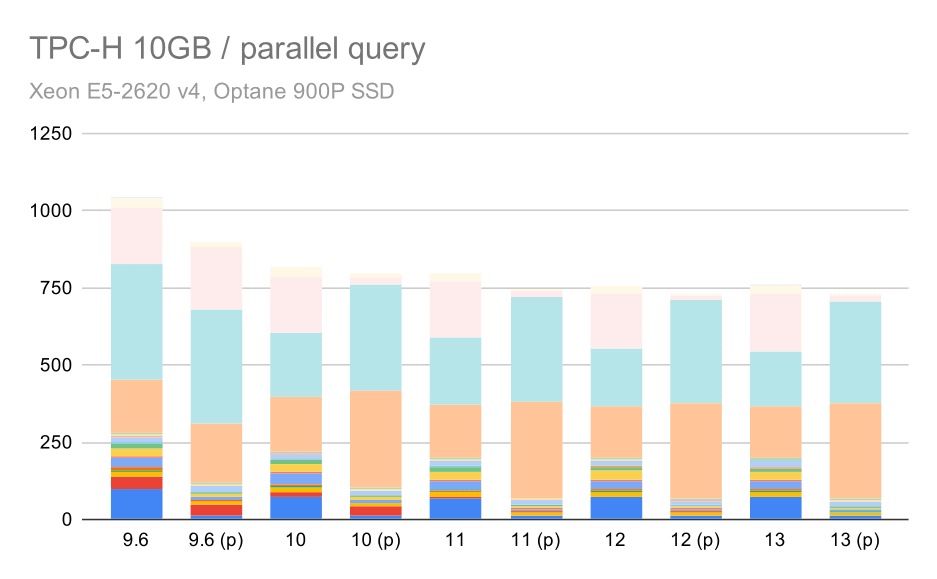
TPC-H queries on medium data set (10GB) – parallelism enabled
This is yet another demonstration of the already discussed issue – enabling parallelism allows considering additional query plans, and clearly the estimates or costing do not match the reality, resulting in poor plan choices.
And finally the large data set, where the complete results look like this:
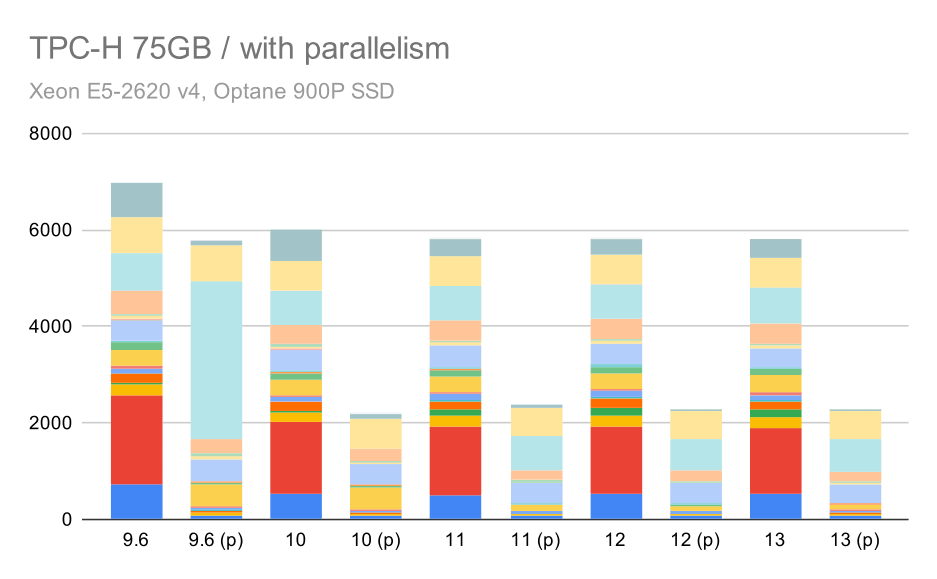
TPC-H queries on large data set (75GB) – parallelism enabled
Here enabling the parallelism works in our advantage – the optimizer manages to build a cheaper parallel plan for Q2, overriding the poor plan choice introduced in 9.3. But just for completeness, here are the results without Q2.
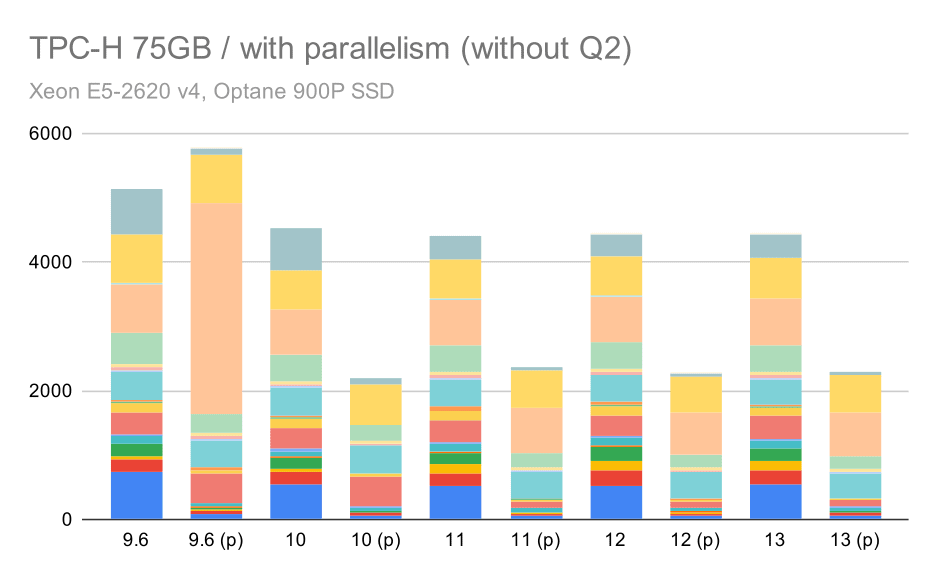
TPC-H queries on large data set (75GB) – parallelism enabled, without problematic Q2
Even here you can spot some poor parallel plan choices – for example the parallel plan for Q9 is worse up until 11 where it gets faster – likely thanks to 11 supporting additional parallel executor nodes. On the other hand some parallel queries (Q18, Q20) get slower on 11, so it’s not just rainbows and unicorns.
Summary and Future
I think these results nicely demonstrate the optimizations implement since PostgreSQL 8.3. The tests with parallelism disabled illustrate improvements in efficiency (i.e. doing more with the same amount of resources) – the data loads got ~30% faster and queries got ~2x faster. It’s true I’ve ran into some issues with inefficient query plans, but that’s an inherent risk when making the query planner smarter. We’re continuously working on making the results more reliable, and I’m sure I could mitigate most of these issues by tuning the configuration a bit.
The results with parallelism enabled show that we can utilize extra resources effectively (CPU cores in particular). The data loads don’t seem to benefit from this very much – at least not in this benchmark, but the impact on query execution is significant, resulting in ~2x speedup (although different queries are affected differently, of course).
There are many opportunities to improve this in future PostgreSQL versions. For example there’s a patch series implementing parallelism for COPY, speeding up the data loads. There are various patches improving execution of analytical queries – from small localized optimizations to big projects like columnar storage and execution, aggregate push-down, etc. A lot can be gained by using declarative partitioning too – a feature I mostly ignored while working on this benchmark, simply because it would increase the scope way too much. And I’m sure there are many other opportunities that I can’t even imagine, but smarter people in the PostgreSQL community are already working on them.
Appendix: PostgreSQL Configuration
Parallelism disabled
shared_buffers = 4GB
work_mem = 128MB
vacuum_cost_limit = 1000
max_wal_size = 24GB
checkpoint_timeout = 30min
checkpoint_completion_target = 0.9
# logging
log_checkpoints = on
log_connections = on
log_disconnections = on
log_line_prefix = '%t %c:%l %x/%v '
log_lock_waits = on
log_temp_files = 1024
# parallel query
max_parallel_workers_per_gather = 0
max_parallel_maintenance_workers = 0
# optimizer
default_statistics_target = 1000
random_page_cost = 60
effective_cache_size = 32GB
Parallelism enabled
shared_buffers = 4GB
work_mem = 128MB
vacuum_cost_limit = 1000
max_wal_size = 24GB
checkpoint_timeout = 30min
checkpoint_completion_target = 0.9
# logging
log_checkpoints = on
log_connections = on
log_disconnections = on
log_line_prefix = '%t %c:%l %x/%v '
log_lock_waits = on
log_temp_files = 1024
# parallel query
max_parallel_workers_per_gather = 16
max_parallel_maintenance_workers = 16
max_worker_processes = 32
max_parallel_workers = 32
# optimizer
default_statistics_target = 1000
random_page_cost = 60
effective_cache_size = 32GB
