Orange is continuously being improved and made more friendly and useful for the users based on their feedback and experiences. Some new features were already described in Part 1 of this blog series. Two other new features that appeared recently (available in the latest 2UDA package) are the Color widget and the reporting functionality.
The Color widget introduces a handy new way to assign colors to variable values, appending this information to the data so that it is used in all subsequent visualizations. In older versions the user had the option to set the color palette in individual visualization widgets, which meant that the process had to be repeated in each widget. To try out the new feature with 2UDA, start Orange, and use the Sql Table widget to open the sample_cars table from the included postgresql database (host=localhost, database=sample, user=postgres). We can observe that the origin variable has 3 different values with very non-informative names (1, 2, and 3). Inspecting the rows in Data Table, we can see that origin values could probably be interpreted as: 1=USA, 2=Europe, 3=Asia. The Color widget allows us to assign colors that users expect and associate with these values. While this is of course subjective and can be culturally dependent, it can significantly improve the ease of processing visualizations for a target audience.
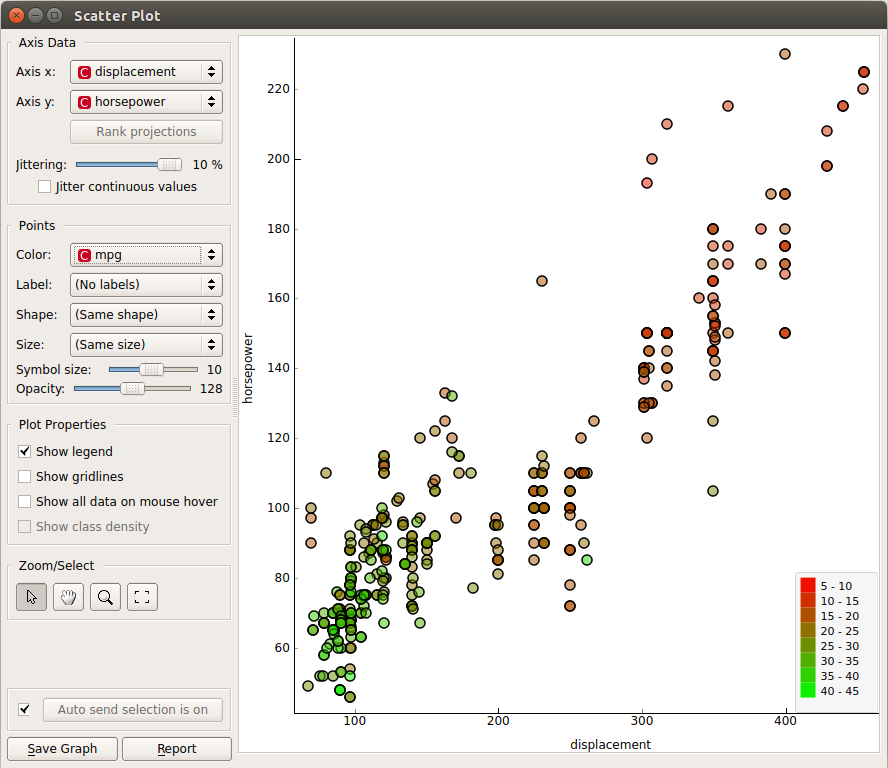
We chose the following value-color pairs: USA=blue, Europe=green, Asia=yellow. Another functionality of the Color widget is that the values (and variables) can also be renamed, so we also changed the numeric IDs with more understandable descriptions. The color spectrum for the mpg variable (miles-per-gallon) was also changed to reflect the economy of a car’s fuel consumption (efficient=green, inefficient=red). Now, when we use e.g. the Distributions or Scatter Plot widgets, they automatically use the new settings.
Reporting is a very useful new feature which adds a report button to most widgets and allows the user to very easily compile a document describing the actions performed, settings used and also includes the produced visualizations. It makes it much easier to share the results with your colleagues as the reports can be saved as html files and viewed in any browser. The best way to see how it works is to try making a report yourself. A simple example of a report containing visualizations of the sample_cars data set used above (and included in a 2UDA installation) is available here.


