Improving PostgreSQL performance without making changes to PostgreSQL
I’d like to introduce a series of articles describing aspects of your server and its performance, and how in many cases, you can significantly improve the performance of PostgreSQL without making any changes to PostgreSQL configuration, SQL queries or other areas of PostgreSQL that have been covered by previous articles.
This is not to say that those other areas aren’t worth considering; good query optimisation, an appropriate setting for work_mem and shared_buffers, or the use of a connection pooler can make massive differences to your overall PostgreSQL performance.
Many of the concepts I will discuss may be new to you, but once you have a holistic view of your server, O/S and applications, you will be able to make many more tuning choices, some of which can offer quite dramatic improvements to database performance.
I’ll talk primarily about Red Hat 7 and 8 on x86 architecture as many EDB customers use these combinations, although most, if not all, of the areas discussed are relevant to other Linux distributions, FreeBSD and other Operating systems too, on x86, IBM POWER, ARM and RiscV architectures.
In this first article, I’m going to talk about Linux Huge Pages.
Huge Pages offer a considerable opportunity for performance improvement. Every application and database workload is different; some workloads get a little more performance out of Huge Pages, and some get a lot more, but the more CPU cores and more main memory being used by PostgreSQL, the bigger the improvements you will get from using Huge Pages.
This article covers the use of Huge Pages with PostgreSQL. For information about using Huge Pages with your hypervisor or a container orchestration platform, please see the appendix.
Huge Pages
What exactly is a Huge Page?
The x86 CPU has the ability to use different sized memory pages. On a reasonably modern x86 CPU, the available page sizes are 4kB, 2MB or 1GB. On Linux, anything other than the standard 4kB page is called a Huge Page.
It should be noted that Transparent Huge Pages (THP) are not the same thing as Huge Pages. We’ll discuss THP in a future article, but for now, the simple advice is to disable THP.
What exactly is a memory page?
To quote Wikipedia¹
“A page, memory page, or virtual page is a fixed-length contiguous block of virtual memory, described by a single entry in the page table. It is the smallest unit of data for memory management in a virtual memory operating system.”
An important thing to note here, which we’ll come back to shortly, is the reference to page tables.
Other than that, it should be noted that physical memory is mapped into a virtual address space (at the exact moment that memory is needed) for use by a running application. The Operating System needs to work in concert with the CPU to manage this mapping.
As you can imagine, when the O/S and the CPU have to constantly map lots of 4kB chunks of physical memory to virtual address spaces in order to allow your application to work smoothly, the CPU and O/S have a lot of work to do, and the more memory your server has, the more 4kB pages the CPU and O/S have to manage.
If the O/S can do this mapping in 2MB chunks or 1GB chunks at a time, instead of 4KB at a time, then as you have probably already guessed, the CPU and O/S need to do less work. This means more CPU time (and potentially storage I/O time) is available for your application(s).
Page mapping
There are four potential scenarios with page mapping.
- TLB hit (best case)
- TLB miss
- Minor page fault
- Major page fault (worst case)
TLB hit
When a process tries to access a memory address within a memory page, the CPU, or more accurately the Memory Management Unit (MMU) of each CPU core, checks to see if that specific logical memory page is currently mapped to the physical memory page via the Translation Lookaside Buffers (TLB), which is a fairly small hardware based cache on the MMU.
If the memory translation values are already present in the TLB, the requested mapping is already cached and nothing more needs to be done. As the TLB is hardware based, the memory mapping is really quick; it typically costs 0.5 – 1 clock cycle on most modern hardware.
If we wanted to be a bit more precise, the MMU does not actually check for a matching page, but uses Content Addressable Memory (CAM) to try to match the requested page, and if matched, this is a TLB hit.
I won’t go into much more detail on the TLBs inner workings, as that is a complex subject. Different CPU architectures and families implement TLB differently; suffice to say that a TLB hit is a very good thing.
TLB miss
If the physical to virtual memory mapping value is not already present in the TLB, then a small dedicated part of physical memory is checked to see if the mapping value is available there instead.
If the mapping value is found, then that value is loaded into the TLB, and the memory page to virtual memory mapping is then available to your application, and your program will continue with very little delay.
This is known as a TLB miss. This is the second best case, but will incur a small performance penalty, although this is still pretty quick. A TLB miss would typically incur a penalty of 10 – 100 clock cycles.
Minor page fault
Now, this is important. Please note that page fault does not mean error.
If you have neither a TLB hit nor a TLB miss, then a minor page fault is generated, and the task of mapping the physical memory page to a virtual memory address is handed over to the O/S.
Once a minor page fault has been generated, the O/S scans a table of page mappings (called PageTables) that the O/S manages. The O/S “walks the page tables” to retrieve the desired mapping. If found, the O/S then sets this mapping in the TLB. If not found, a new entry is added to the page table, and this mapping is then set in the TLB.
If there are a large number of entries in the page tables, then this “page walk” can take the O/S quite a long time; compared to a TLB hit, this is very slow indeed, and once the page tables start to get larger, users and applications start to notice the impact.
This is the key point; the larger the page tables, the more impact on your server’s performance.
The way to reduce the O/S overhead for page walks is to reduce the size of the page tables. This is one of the key things we are doing when we use Huge Pages.
Major page fault
There is one other scenario; a major page fault.
A major page fault occurs when you are moving something into memory that wasn’t there previously, e.g. fork a new process, load an application from storage for the first time, or retrieve something from swap.
Typically, you will see a lot of minor page faults and very few major page faults. If you start to see a lot of major page faults, you should take a close look at your system to make sure it isn’t overloaded. You may be doing a lot of swapping or a lot of forking of new processes. (Maybe it’s time for a PostgreSQL connection pooler?)
How do we examine the size of the page tables?
This is how to see the current size of the page tables:
cat /proc/meminfo | grep PageTables
PageTables:        23044 kB
At around 23MB, this should be considered to be a small page table size.
EDB has seen page tables as large as 11GB on running client systems.
When the page tables get this large (or larger), server performance starts to noticeably degrade.
With the 11GB page tables example, a good amount of the performance degradation was directly attributable to the use of the default Linux page size settings (4kB). When Huge Pages were configured to 2MB and their use was enforced, performance improved significantly - CPU use went from 51% in use to 15% in use, with exactly the same load. Who doesn’t want that?
How do we monitor the number of page faults?
There are a few ways to examine the number of page faults.
Using ps to examine a single process, display the number of minor and major page faults:
ps -o min_flt,maj_flt <PID>
So for example, PID 2216:
ps -o min_flt,maj_flt 2216
 MINFL  MAJFL
 52152     11
Alternatively, use sar once a second for 4 seconds to check the overall page faults on your system:
(sar can be installed like this: yum/dnf -y install sysstat)
Example with almost no load on the system:
sar -B 1 4
11:16:02     pgpgin/s pgpgout/s   fault/s  majflt/s  pgfree/s pgscank/s pgscand/s pgsteal/s
11:17:56         0.00      0.00     29.00      0.00     67.00      0.00      0.00      0.00
11:17:57         0.00    256.00     38.00      0.00     57.00      0.00      0.00      0.00
11:17:58         0.00     16.00     30.00      0.00     57.00      0.00      0.00      0.00
11:17:59         0.00      0.00     28.00      0.00     48.00      0.00      0.00      0.00
Example as a small load is applied to PostgreSQL:
sar -B 1 4
11:16:02     pgpgin/s pgpgout/s   fault/s  majflt/s  pgfree/s pgscank/s pgscand/s pgsteal/s
11:18:00         0.00   6568.00  21109.00      0.00   1510.00      0.00      0.00      0.00
11:18:01         0.00  11000.00    213.00      0.00   1601.00      0.00      0.00      0.00
11:18:02         0.00  10496.00   1494.00      0.00   2116.00      0.00      0.00      0.00
11:18:03         0.00   8920.00    163.00      0.00   1268.00      0.00      0.00      0.00
The fault/s and majflt/s columns are of interest here. Faults per sec is the sum of the major and minor page faults. You can see that the number of page faults has increased with a small test load, but once you get used to looking at these numbers, you’ll see that this is still a lightly loaded system.
Here is an example of a mid-sized load applied to PostgreSQL:
sar -B 1 4
00:56:43     pgpgin/s pgpgout/s   fault/s  majflt/s  pgfree/s pgscank/s pgscand/s pgsteal/s
00:56:44         0.00      0.00  52481.00      0.00  14699.00      0.00      0.00      0.00
00:56:45         0.00      0.00  60464.00      0.00  75041.00      0.00      0.00      0.00
00:56:46         0.00     40.00  41237.00      0.00 119788.00      0.00      0.00      0.00
00:56:47         0.00      0.00  44462.00      0.00 126337.00      0.00      0.00      0.00
You can see that as more load is applied to the server, the number of page faults increases.
What Huge Page sizes do I have available on my server?
To check if your server/VM supports 2MB Huge Pages, check for the pse (Page Size Extension) flag in the CPU flags like this:
cat /proc/cpuinfo | grep pse
flags       	: fpu vme de pse tsc msr pae mce cx8 apic sep mtrr pge mca cmov pat pse36 clflush acpi mmx fxsr sse sse2 ss ht syscall nx pdpe1gb rdtscp lm constant_tsc rep_good nopl eagerfpu pni pclmulqdq ssse3 fma cx16 pcid sse4_1 sse4_2 x2apic movbe popcnt tsc_deadline_timer aes xsave avx f16c rdrand hypervisor lahf_lm abm invpcid_single fsgsbase tsc_adjust bmi1 avx2 smep bmi2 erms invpcid xsaveopt
{…}
You will see output for each server core. For a shorter output you can do this:
cat /proc/cpuinfo | grep -o ".\{0,0\}pse.\{0,0\}" | head -n 1
pse
Note that on the first of the two grep examples for the 2MB Huge Pages, you will also likely see this flag:
pse36
This pse36 (36-bit Page Size Extension) flag means your x86 CPU cores extend their physical memory addressing capabilities from 32 bits to 36 bits, allowing memory addressing of 64 GB of memory instead of having a 4GB maximum.
To check if your server/VM supports 1GB Huge Pages, check for the pdpe1gb (GB Pages) flag in the CPU flags like this:
cat /proc/cpuinfo | grep pdpe1gb
flags       	: fpu vme de pse tsc msr pae mce cx8 apic sep mtrr pge mca cmov pat pse36 clflush acpi mmx fxsr sse sse2 ss ht syscall nx pdpe1gb rdtscp lm constant_tsc rep_good nopl eagerfpu pni pclmulqdq ssse3 fma cx16 pcid sse4_1 sse4_2 x2apic movbe popcnt tsc_deadline_timer aes xsave avx f16c rdrand hypervisor lahf_lm abm invpcid_single fsgsbase tsc_adjust bmi1 avx2 smep bmi2 erms invpcid xsaveopt
{…}
You will see output for each server core. For a shorter output you can do this:
cat /proc/cpuinfo | grep -o ".\{0,0\}pdpe1gb.\{0,0\}" | head -n 1
pdpe1gb
My test server therefore has pse and pdpe1gb, meaning both 2MB and 1GB Huge Pages are available for me to use.
A side-note on swap:
Once configured, Huge Pages are locked in memory, meaning they will never be sent to swap.
How to right-size and set up Huge Pages for PostgreSQL
These are the steps required to configure the right amount of Huge Pages for PostgreSQL to use:
- Make sure PostgreSQL is running with our intended shared_buffers setting
- Get the current memory footprint of the PostgreSQL postmaster process as that is the parent process which allocated the shared_buffers
- Calculate how many Huge pages we need based upon that memory footprint
- Stop PostgreSQL
- Setup the Huge Pages
- Check the postgresql.conf huge_pages setting
- Start PostgreSQL
- Confirm everything is running correctly
1. Make sure PostgreSQL is running
Set shared_buffers to the size you want in postgresql.conf, then:
systemctl start postgres or systemctl start edb-as-13 or pg_ctl -D /my/data/dir/ -W start or your normal preferred way.
2. Get the current memory footprint of the PostgreSQL postmaster
Get the process ID of the running postmaster:
ps -aux | grep [p]ostmaster | awk {'print$2'}
34764
In my example, the PID of the postmaster process is 34764.
Then display the memory use of that process ID (PID):
pmap 34764 | awk '/rw-s/ && /zero/ {print $2}'
8402592K
3. Calculate the number of Huge Pages we need
Check the current Huge Page size. In my example, I can see 2048kB pages sizes, but if you have set up 1GB Huge Pages, you will see 1048576 kB as the Hugepagesize value. Note that other CPU architectures such as IBM POWER may offer different Huge Page sizes.
grep ^Hugepagesize /proc/meminfo
Hugepagesize:       2048 kB
Then divide the memory footprint by the Huge Page size and round up, so in my example for 2MB pages:
8402592/2048 = 4102.828125
I need at least 4103 Huge Pages for PostgreSQL’s use.
4. Stop PostgreSQL
PostgreSQL needs to restart in order to use Huge Pages, and stopping PostgreSQL at this point will free up some memory blocks.
systemctl stop postgres or systemctl stop edb-as-13 or pg_ctl -D /my/data/dir/ -W stop or your normal preferred way.
5. Setup the Huge Pages
Set this immediately after stopping PostgreSQL:
sysctl -w vm.nr_hugepages=4103
Then add this line to /etc/sysctl.conf so that that change survives a reboot:
vm.nr_hugepages = 4103
Then apply the sysctl values like this:
sysctl -p
Finally, confirm this change has been accepted by Linux:
sysctl -a | grep "vm.nr_hugepages "
  vm.nr_hugepages = 4103
6. Check the postgresql.conf huge_pages setting
Normally, I would now change the postgresql.conf huge_pages parameter to on and restart PostgreSQL, which guarantees that PostgreSQL will use the Huge Pages.
If you change the huge_pages parameter to on, and PostgreSQL fails to secure the Huge Pages it needs upon startup, PostgreSQL will issue a clear error to the log and you can quickly rectify the error and restart PostgreSQL.
Given the premise of the series is not to have to change anything to do with PostgreSQL, you can simply leave this alone, as the default setting of the huge_pages parameter is try, so if you have set up Huge Pages correctly in the O/S, PostgreSQL will now use them anyway.
7. Start PostgreSQL
systemctl start postgres or systemctl start edb-as-13 or pg_ctl -D /my/data/dir/ -W start or your normal preferred way.
8. Confirm PostgreSQL is running
ps -aux | grep [p]ostmaster
enterpr+  34812  0.0  0.6 8680052 197912 ?      Ss   12:34   0:04 /usr/edb/as13/bin/edb-postmaster -D /var/lib/edb/as13/data
And that’s it, we are now using Huge Pages.
Some practical examples and benchmarks
We can test using pgbench.
Server details
CPU core type : Intel(R) Xeon(R) CPU E5-2687W v3 @ 3.10GHz
Hypervisor type : Xen
Virtualisation type : HVM
CPU Cores : 8 and 20 vCPU cores (2 tests), VM cores pinned to physical cores
Memory : 32GB
Balloonable memory : off
Storage : 100GB XFS, no special XFS settings as storage is not used in the test
Software details
Operating System : Red Hat Enterprise Linux 8.2 (Oopta)
Linux Kernel : 4.18.0-305.12.1
Database : EDB Advanced Server v13.x
Load Generator : pgbench
Load Generation Server (LGS) : separate 16 core server, connected over 10Gb Ethernet TCP/IP
Software patch date : 24th August 2021, all software updated to latest
Set up our test environment
1. PostgreSQL Settings:
shared_buffers = 8GB
2. Setup pg_bench:
psql -h 10.0.0.100 -U enterprisedb -p 5444 -d template1 -c "CREATE DATABASE pgbench_test_db;"
pgbench -h 10.0.0.100 -U enterprisedb -p 5444 -i -s450 pgbench_test_db;
3. Prewarm the tables and issue a checkpoint so that we have no interference from our storage system:
psql -h 10.0.0.100 -U enterprisedb -p 5444 -d pgbench_test_db
CREATE extension pg_prewarm;
SELECT pg_prewarm('pgbench_accounts');
SELECT pg_prewarm('pgbench_branches');
SELECT pg_prewarm('pgbench_history');
SELECT pg_prewarm('pgbench_tellers');
SELECT pg_prewarm('pgbench_accounts_pkey');
SELECT pg_prewarm('pgbench_branches_pkey');
SELECT pg_prewarm('pgbench_tellers_pkey');

CHECKPOINT;
\q
So we know this fits in the 8GB shared buffers that we allocated (you can check by using the pg_buffercache extension if you wish).
We will shortly run the following select-only test as we are testing memory paging and not storage I/O here:
pgbench -h the_database -U enterprisedb -p 5444 -c <n> -j <n> -T 60 -S -n --random-seed=1234 pgbench_test_db
Where <n> is the number of connections and threads, the same value used for both
One thing to note with tests is that when monitoring using sar -B 1 100 (as noted earlier) is that when 4kB pages are used, the number of page faults range from 1000 minor faults/sec for an 8 connection test through to 200,000+ page faults per second for a 400 connection test.
Both the 2MB and 1GB pages show 0 page faults once the database connections have been made and the test is running.
With any size of pages, whether 4KB, 2MB or 1GB, whilst the connections are being made against the database, many minor page faults occur. This is because the Linux forking of each new back end generates page faults as part of the forking process.
Once the connections are made and the test is started, there is no more forking and therefore no extra page faults are generated.
As an aside, this forking (which generates page faults) is one of the reasons that a connection pooler is so advantageous, as process forking and thus the page faults associated with the forking then happen very rarely, but we’ll discuss connection pooling in a future article.
Eight vCPU test, eight connections through to 400 connections
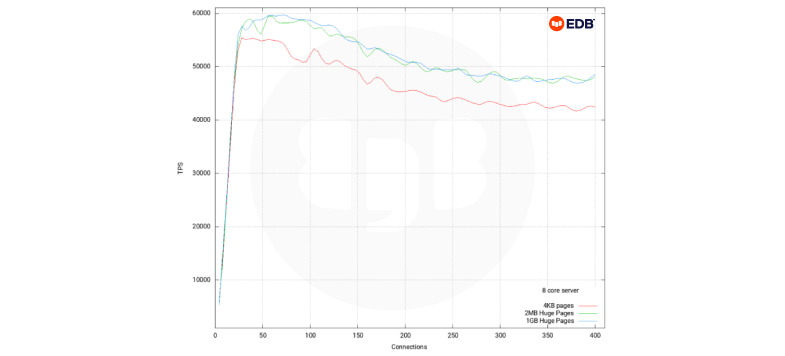
Pgbench synthetic test.
pgbench -h the_database -U enterprisedb -p 5444 -c <n> -j <n> -T 60 -S -n --random-seed=1234 pgbench_test_db
Where <n> is the number of connections and threads, the same value used for both.
We can see from this test that Huge Pages of either 2MB or 1GB are beneficial once we have more than around 30 active backend connections, we can also see that as we only have eight cores in our server, the difference between 2MB and 1GB pages is not overly pronounced for this particular test.
Once we get beyond about 80 connections, we see a fairly consistent 10% to 13% improvement with Huge Pages over normal 4kB pages.
20 vCPU test, eight connections through to 400 connections
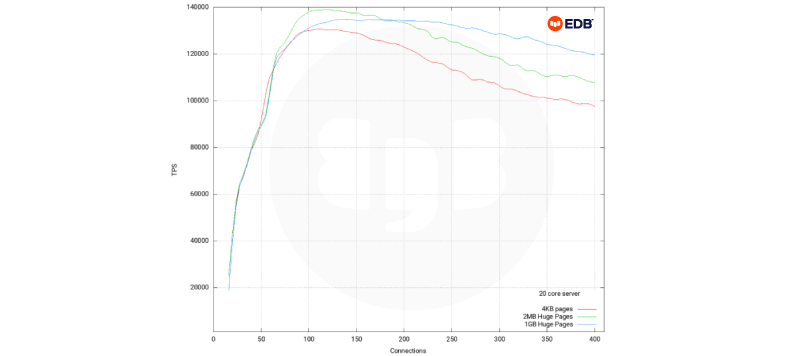
Pgbench synthetic test.
pgbench -h the_database -U enterprisedb -p 5444 -c <n> -j <n> -T 60 -S -n --random-seed=1234 pgbench_test_db
Where <n> is the number of connections and threads, the same value used for both
We can see from this test that Huge Pages of either 2MB or 1GB are beneficial once we have more than around 90 active backend connections; we can also see that now that we have more CPU cores in use, we can see that there is a significant difference with 2MB and 1GB Huge Pages.
Once we get over 180 active connections, we see between around 9% and 20% better performance using Huge Pages over 4kB pages.
Every server configuration offers different results and although it is not shown in the graphs above, it is obvious that every application load is different and that will offer different results too.
Some server cores have better cache sizes, some have larger/better designed TLBs, others have different speed RAM attached to them and therefore some servers are slower and some are faster.
The conclusion
The main takeaway is that it’s always beneficial to use Huge Pages with PostgreSQL.
The most significant benefit of using Huge Pages is the reduction in CPU use.
EDB has customers who have seen average CPU use on servers go down from 45% to 15%, simply by starting to use 2MB Huge Pages.
A note for your CFO; this means that the same workload uses less resources, therefore potentially saving on CAPEX and OPEX for the same load, allowing more load on the same VM. By using Huge Pages, you can get better value for money.
My advice:
- Setup a test server
- Make sure that neither Transparent Huge Pages nor Huge Pages are enabled and run a load test (ideally use your normal application); monitor and record the results
- Repeat with 2MB Huge Pages, monitor and record the results
- Finally, repeat the same test with 1GB Huge Pages, monitor and record the results
- Determine which one works best for you
- Put it into production…!
I hope this was an interesting introduction into what Huge Pages are and what they can do for you and PostgreSQL.
All best
Phil Allsopp
1. https://en.wikipedia.org/wiki/Page_(computer_memory)
2. https://docs.vmware.com/en/VMware-vSphere/7.0/com.vmware.vsphere.resmgmt.doc/GUID-ED2634FA-6DB3-468D-996E-867545328C2C.html
3. https://docs.vmware.com/en/VMware-vSphere/7.0/com.vmware.vsphere.resmgmt.doc/GUID-F0E284A5-A6DD-477E-B80B-8EFDF814EE01.html
Appendix
Hypervisor support for Huge Pages
VMware
Modern versions of ESXi support 2MB Huge Pages by default².
vSphere 6.7 ESXi and above provide support for backing guest vRAM with 1GB pages³.
In order to use 1GB Huge Pages,this option needs to be applied to the VM:
sched.mem.lpage.enable1GPage = "TRUE"
VMware 1GB pages are opportunistic and any VM that needs 1GB Huge Pages should ideally be started soon after VMware is started so that any memory fragmentation is limited.
Xen
Most recent versions of the Xen hypervisor support Huge Pages by default.
It should be noted that HVM and PVH guests support Huge Pages in the hypervisor whereas PV guests do not.
Memory ballooning can cause memory fragmentation which can make Huge Pages unavailable as the Xen memory ballooning driver does not support Huge Pages.
For PostgreSQL use, the minimum and maximum memory settings for a VM should be set to the same value so that the memory ballooning driver is never used.
KVM
Linux Kernel based Virtual Machine (KVM) code has been built into the Linux kernel since Kernel 2.6.20 in 2007 and Huge Pages with KVM have been available since Kernel 2.6.23.
Typically you would use virsh to dump the VM’s config (virsh dumpxml), add the hugepages tag like so:
a minimal example:
<memoryBacking>
  <hugepages/>
</memoryBacking>
A more detailed example:
<memoryBacking>
  <hugepages>
    <page size="1" unit="G" nodeset="0-3,5"/>
    <page size="2" unit="M" nodeset="4"/>
  </hugepages>
  <nosharepages/>
  <locked/>
</memoryBacking>
This would allow a guest VM to use Huge Pages and then you would recreate the VM with virsh.
Please refer to your O/S documentation for more information on using KVM.
Openshift and Kubernetes
Openshift and other Kubernetes flavours can benefit from Huge Pages for all the same reasons as we have already discussed.
You should note that because of the fluid nature of the way Openshift and Kubernetes creates, evicts and recreates pods, you would need to consider the use of Huge Pages a little more carefully. My advice is to set the PostgreSQL parameter huge_pages to ‘try’, to make sure that when a PostgreSQL Pod is scheduled to a node, that you can start up the PostgreSQL Pod even if you do not have enough Huge Pages available to you on that worker node.
There are different ways to approach Huge Pages use on Openshift and each has many options.
The following simple example was used on Openshift 4.8 worker node:
# oc label node <node_using_hugepages> node-role.kubernetes.io/worker-hp=

# cat hugepages-tuned-boot-time.yaml

apiVersion: tuned.openshift.io/v1
kind: Tuned
metadata:
  name: hugepages
  namespace: openshift-cluster-node-tuning-operator
spec:
  profile:
  - data: |
      [main]
      summary=Boot time configuration for hugepages
      include=openshift-node
      [bootloader]
      cmdline_openshift_node_hugepages=hugepagesz=2M hugepages=1000
    name: openshift-node-hugepages

  recommend:
  - machineConfigLabels:
      machineconfiguration.openshift.io/role: "worker-hp"
    priority: 30
    profile: openshift-node-hugepages


# oc create -f hugepages-tuned-boot-time.yaml


# cat hugepages-machine_config_pool.yaml

apiVersion: machineconfiguration.openshift.io/v1
kind: MachineConfigPool
metadata:
  name: worker-hp
  labels:
    worker-hp: ""
spec:
  machineConfigSelector:
    matchExpressions:
      - {key: machineconfiguration.openshift.io/role, operator: In, values: [worker,worker-hp]}
  nodeSelector:
    matchLabels:
      node-role.kubernetes.io/worker-hp: ""

# oc create -f hugepages-machine_config_pool.yaml
You will need to restart your node to apply the change as it is setup at boot time
After a reboot, wait a short time for everything to be applied then issue this command
# oc get node <node_using_hugepages> -o jsonpath="{.status.allocatable.hugepages-2Mi}"
Practical notes
If you have a running primary (master) and replica(s), you can quickly stop PostgreSQL running on a replica, set up Huge Pages, and then start PostgreSQL again with no downsides.
You will also see how long it takes to make the change and decide whether to accept a very small downtime when updating your primary PostgreSQL server, or whether to do a managed switchover using something like EDB’s EFM product or Repmgr before making the change.
Of course, if you were running something like EDB’s BDR this all becomes a moot point, as the upgrades and maintenance work can be done with zero downtime.
BDR is EDB’s PostgreSQL Multi-Master solution. BDR has many benefits and many exciting features; if you want to know more about BDR, please click this link for an overview.
Acknowledgements
I would like to acknowledge the following individuals for their collaboration and support:
Alok Mishra, Amit Singh, Boriss Mejias, Kase, Phil Hankinson, Rajendra Somthankar and Oscar Herrera.
Read More: Cool New Contributions to PostgreSQL 14