I’m not going to repeat the explanation of how sequential UUIDs work – you can find that in the previous post. I’ll just show results on SSDs, with a short discussion.
The tests were done on two different systems I always use for benchmarking. Both systems use SSDs, but quite different types / generations. This adds a bit more variability, which seems like a good thing in this sort of tests anyway.
i5-2500K with 6 x S3700 SSD
This first system is a fairly small (and somewhat old-ish), with a relatively old Intel CPU i5-2500K with just 4 cores, 8GB of RAM and 6 Intel S3700 SSD disks in a RAID0.
The following chart illustrates the throughput for various test scales:
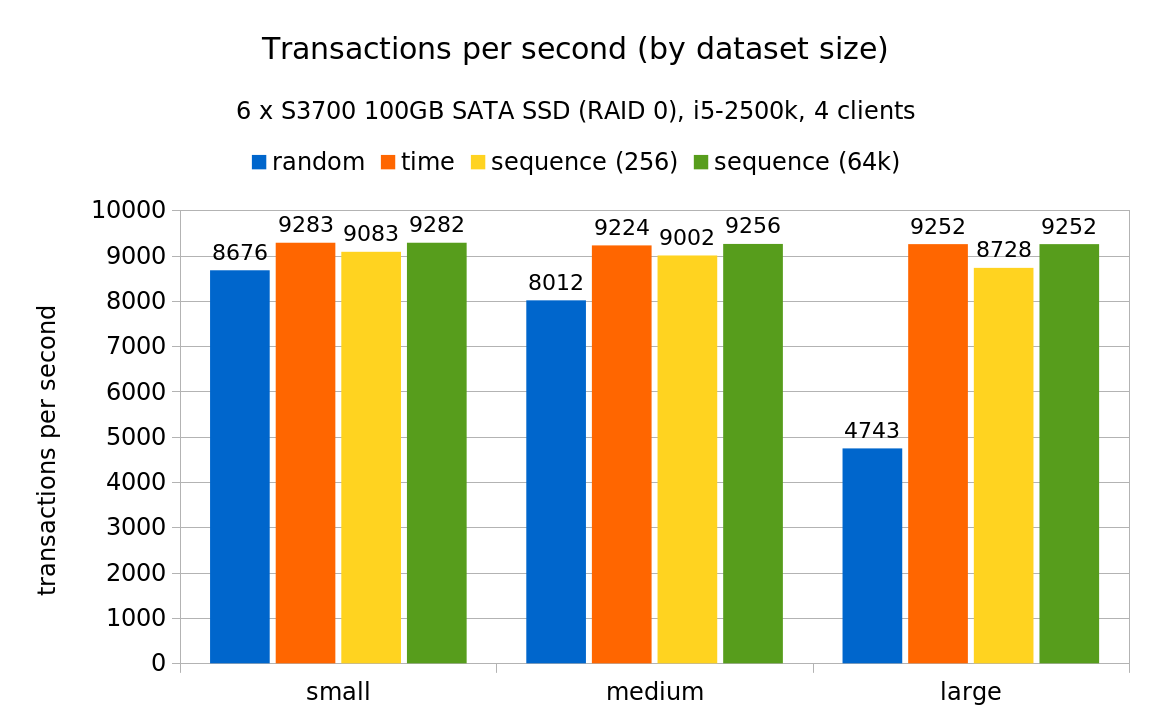
The degradation is clearly not as bad as with rotational storage – on the largest scale it drops “only” to ~50% (instead of ~20%). And for the medium scale the drop is even smaller.
But how is that possible? The initial hypothesis was that the I/O amplification (increase in number of random I/O requests) is the same, independently of the storage system – if each INSERT means you need to do a 3 random I/O writes, that does not depend on storage system type. Of SSDs do not behave simply as “faster” rotational device – that’s an oversimplification. For example most SSDs are internally much more parallel (i.e. can handle more requests concurrently than rorational devices) and can’t directly overwrite data (have to erase whole blocks etc.) which matters for random writes.
But there’s another reason why the random UUIDs perform much better here, illustrated by these WAL stats (all the charts are already normalized to the same throughput):
Note: I’m not showing a chart for the “small” scale here, because due to the high throughput on SSDs the table grows so fast the results are virtually equivalent to the “medium” case. On rotational drives it takes ~4h for the table to grow to ~400MB, while on SSDs the table grows to about 5GB. Which is pretty close to where “medium” starts on this system.
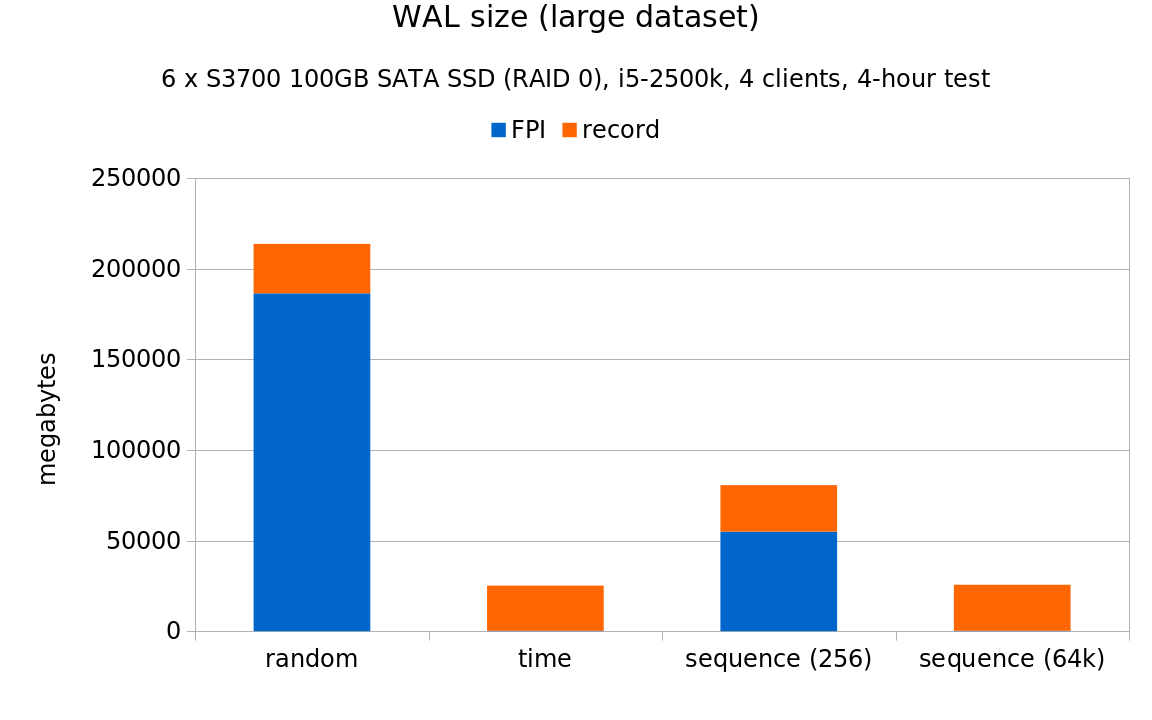
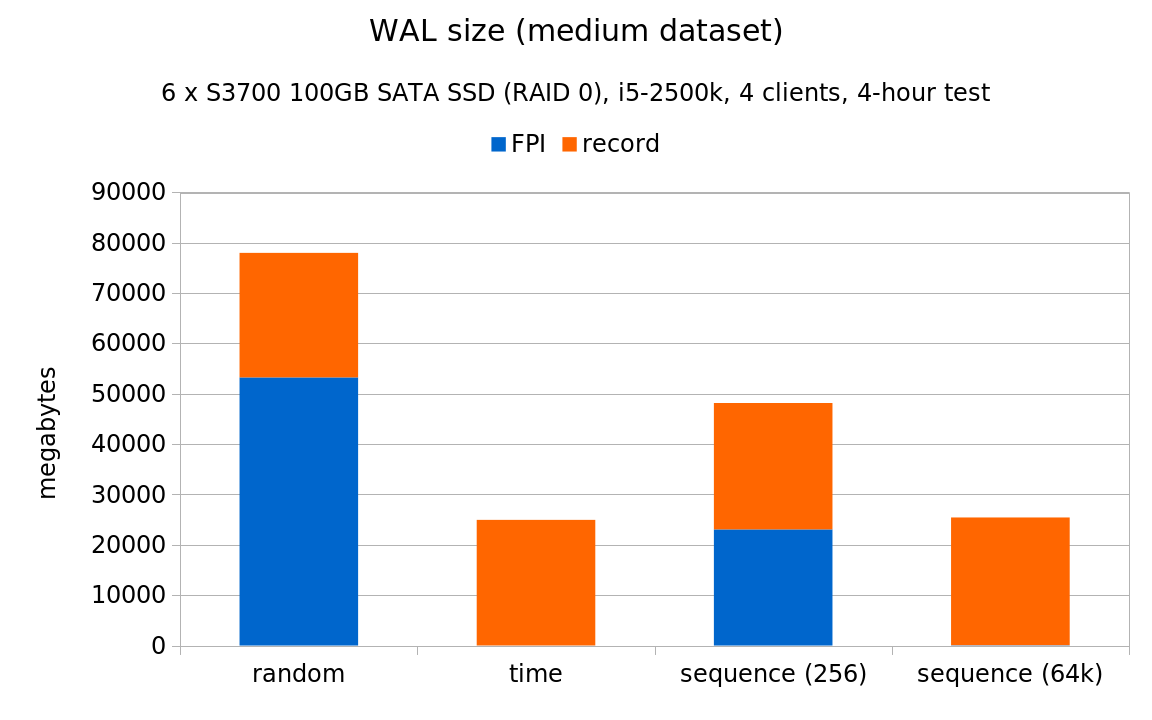
If you compare these charts to the 7.2k SATA results, you’ll notice that on rotational storage >95% of the WAL volume was in FPI. But on SSDs, the fraction of FPI WAL records is much lower – roughly 75-90%, depending on the scale. This is a direct consequence of the much higher throughput on SSDs, because it increases the probability that a given page is modified repeatedly between checkpoints. The non-FPI records are much cheaper, and represent disproportionate number of transactions.
That being said, it’s clear the sequential UUIDs produce much less WAL, and results in significantly higher throughput on the large data set.
e5-2620v4 with Optane 900P SSD
The second system is much beefier and newer (and it’s the same system that was used to collect the 7.2k results). It’s using a fairly new Intel CPU e5-2620v4 with just 8 cores, 64GB of RAM and Intel Optane 900PSSD.
The following chart illustrates the throughput for various test scales:
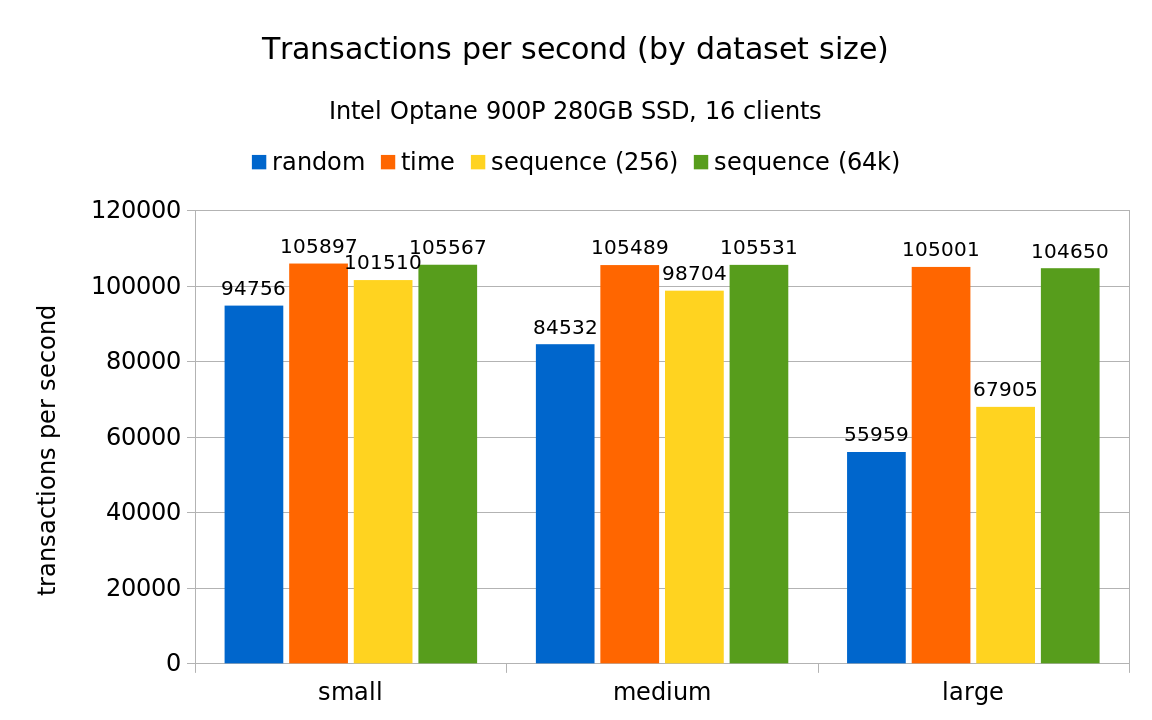
Overall this seems fairly similar to results from the smaller system (ignoring the fact that the numbers are 10x larger). One interesting observation is that the sequence (256) case falls behind on the large data set, most likely due to wrapping around often thanks to the higher throughput. The WAL stats charts (again, omitting results for the “small” scale) look like this:
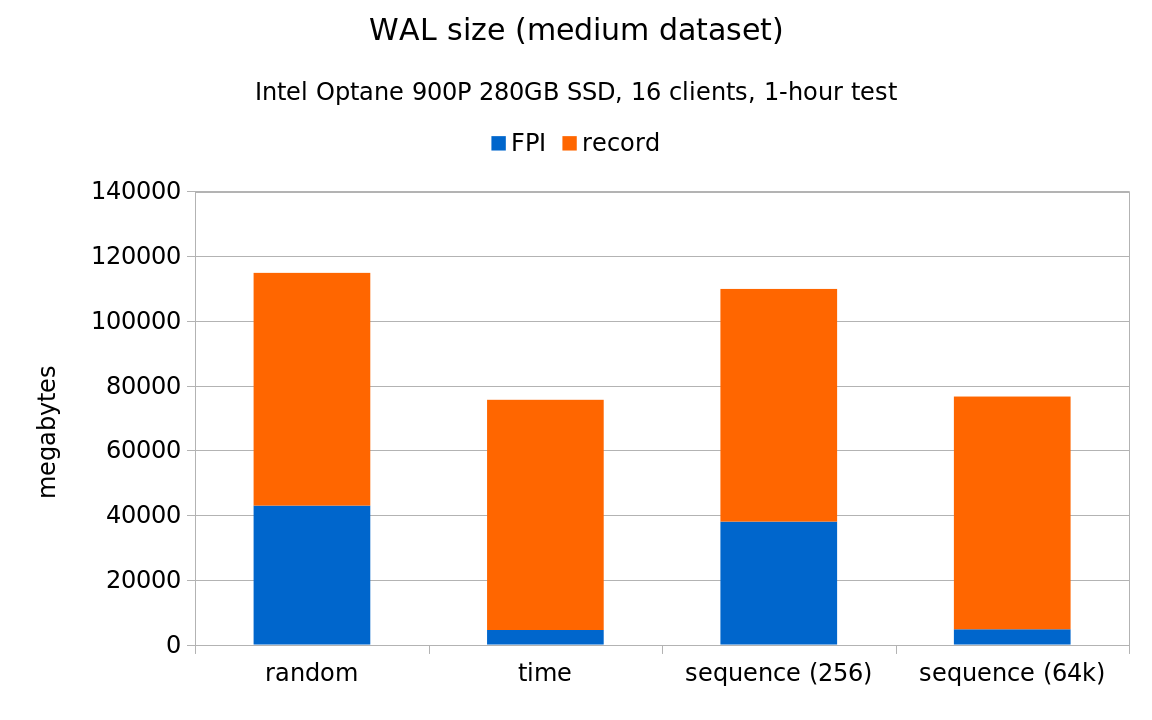
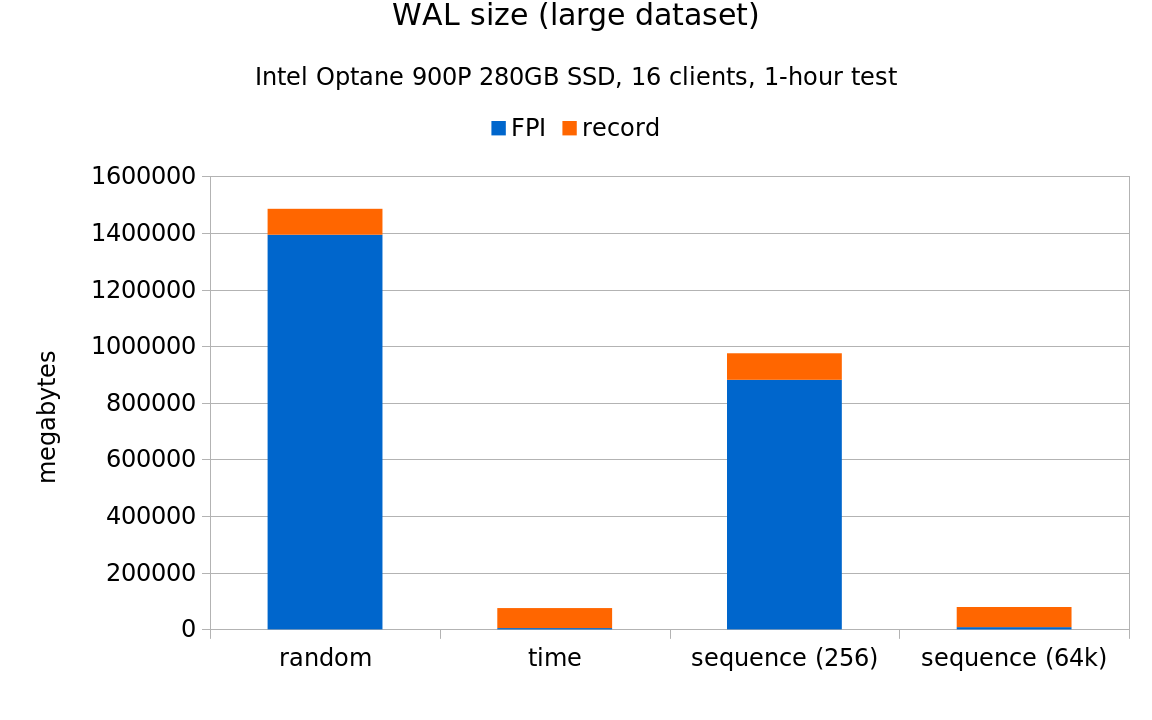
Again, fairly similar to the smaller system, although on the large scale the fraction of FPI pages gets close to the 95% of WAL observed on the 7.2k SATA storage. AFAICS this is due to “large” being about 10x larger on the NVMe system, because it’s derived from the amount of RAM (i.e. it’s not the same on both systems). It also means the checkpoints are triggered more often, causing another round of FPI being written to the WAL.
Conclusion
It’s not easy to compare results from rotational and SSD tests – the higher throughput changes behavior of several crucial aspects (more frequent checkpoints, lower fraction of FPI records, etc.). But I think it’s clear sequential UUIDs have significant advantages even on systems with SSDs storage. Not only does it allow higher throughput, but (perhaps more importantly) it reduces the amount of WAL produced.
The reduced WAL volume might seem non-interesting because the WAL is generally recycled after a while (3 checkpoints or so). But on second thought it’s actually very important benefit – virtually everyone now does base backups, WAL archiving and/or streaming replication. And all these features are affected by the amount of WAL produced. Backups need to include a chunk of WAL to make the backup consistent, WAL archival is all about retaining the WAL somewhere for later use, and replication has to copy the WAL to another system (although FPI may have significant positive benefit on the recovery side).
