What Happens if You Don’t Monitor Your PostgreSQL Database Effectively?

Contributed by Ajay Patel
 A good DBA is someone who knows how to monitor the databases EFFECTIVELY and when it comes to a production or business critical database, the job becomes even more crucial.
Not monitoring your databases and system effectively may lead to a severe catastrophe - application slowness, database crashes or downtime, all of which lead to Business loss and an unhappy customer. I am sure we want to avoid this kind of situation in every possible way.
To address this issue some of the basic questions which we need to understand are:
- What it means to have an effective database monitoring?
- Should it be different for your Production/Critical and Non-critical databases?
- Will it be proactive or reactive monitoring?
- Should it be aligned with your business goals or SLA?
- Does it give you POWER of decision making based upon your SLA?
Should it be different for your Production/Critical and Non-critical databases?
Yes, it should be. Monitoring on production or mission-critical database should be detailed and more frequent as compared to non-critical (development or testing) database. For example, high load on production might ring a bell however in non-production environments it may not be critical.
As a Database Expert we divide our monitoring into different aspects:
- Database Monitoring Points
o Database Down
o Streaming Replication
o Postgres Backend Connections [max connection]
o Bloat Report
o Transaction Wraparound
o Long running query
o Waiting queries
o Idle-in-transaction
o Number of WAL files pending [.ready files]
- Operating System Monitoring Points
o Diskspace alert
o Load-avg
o Memory Usage
As a part of our best practices, we further divide our monitoring in terms of threshold values (when the alert should trigger) and the frequency of execution.
Should it be proactive or reactive monitoring?
The answer is ... both!
A certain aspect of monitoring is based on the reactive approach of proactive monitoring. It might sound little confusing, however the below scenario should be able to help us understand it better:
- Postgres Backend Connections [max connection]
- Configuration details :
- Max_connection set to 1000
- Threshold for Monitoring set to 80% warning(value=800) , 90% Critical (value=900)
- Frequency of execution set to = N
- Configuration details :
N= 10 mins of frequency
12:00AM – First execution: Connection to DB=700
12:01AM – Connection to DB=700
12:02AM – Connection to DB=700
12:03AM – Connection to DB=750
12:04AM – Connection to DB=750
12:05AM -Connection to DB=800
12:06AM -Connection to DB=850
12:07AM – Connection to DB=900
12:08AM – Connection to DB=950
12:09AM -Connection to DB=970
12:10AM – Eleventh execution of Monitoring : Connection to DB=980 (Alert Triggered as Threshold <= No of DB connections)
12:11AM : Connection to DB=990
12:12AM : Connection to DB=1000
12:13AM – Database Out of Memory Error (System Crashed)
Result: DBA didn’t get enough opportunity to react to the alert notification.
Risk Factor: Critical
N= 1 mins of frequency (Proactive Approach)
12:00AM – First execution: Connection to DB=700
12:01AM – Second execution: Connection to DB=700
12:02AM – Third execution: Connection to DB=700
12:03AM – Forth execution: Connection to DB=750
12:04AM – Fifth execution: Connection to DB=750
12:05AM -Sixth execution: Connection to DB=800 (Alert Raised as WarningThreshold >= No of DB connections)
DBA: Login into the system and Start analyzing the issue
12:06AM -Seventh execution: Connection to DB=850(Alert Raised as WarningThreshold >= No of DB connections)
12:07AM – Eighth execution: Connection to DB=900 (Alert Raised: Critical )
12:08AM – Ninth execution: Connection to DB=950(Alert Raised: Critical)
12:09AM – Tenth execution: Connection to DB=970(Alert Raised: Critical)
DBA: Fixed the problem.
12:10AM – Eleventh execution of Monitoring: Connection to DB=800(Alert Triggered WarningThreshold <= No of DB connections)
12:11AM – Eleventh execution of Monitoring: Connection to DB=700
12:12AM – Eleventh execution of Monitoring : Connection to DB=750
12:13AM – Database Out of Memory Error — Never Happened
Result: DBA gets enough opportunity to react to the alert notification.
Risk Factor: Medium
We have eliminated the risk factor to the overall health of the database and SLA by doing smart and proactive monitoring before the bad thing starts happening to the database.
A classic example of reactive monitoring would be database down the issue. Many times we can’t predict issues (hardware failure) with databases (even with all the proactive monitoring), however getting a notification at the right time saves a lot of time to react to the situation and fix the problem.
Should it be aligned with your business goals or SLA?
Absolutely!!
Understanding business goals / SLA and aligning them with monitoring is very important. In operations, we deal with many customers with very unique business goals and infrastructure. For one customer it may be important to track all the long-running queries which might be impacting application performance and for another, it may not be so critical.
Does your Monitoring System gives you POWER of decision making based upon your SLA?
Don’t read further if:
- You are not monitoring Business Critical/Production Database.
- Not really worried about missing of breaking SLA
- Don't care about higher customer satisfaction.
- Not using Cloud.
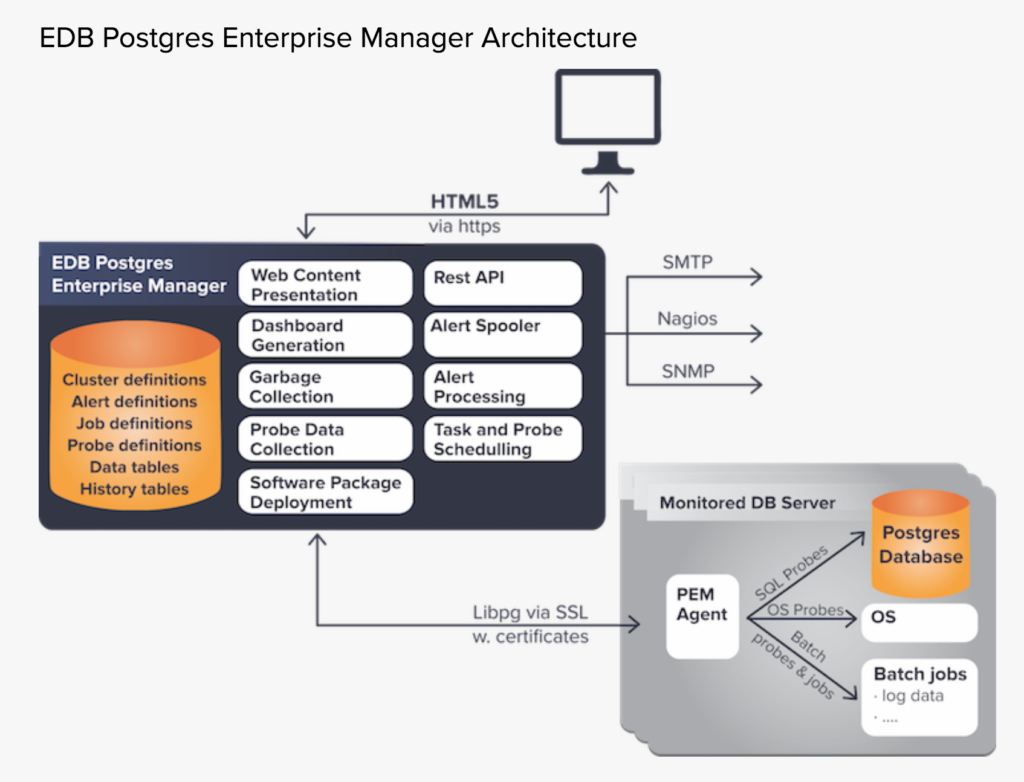
To solve all of the above challenges of an Operations DBA, the EDB Postgres Enterprise Manager (PEM) provides a very unique solution like...
- Monitoring databases and systems (more than 225 pre-configured alerts)
- Centralized console to display data (performance analysis, reporting)
- Customized dashboard which helps for decision making (which alert to react on first) and for more productivity and meaningful work.
From a DBA’s and Operation's perspective, it brings values like:
- Easier deployment
- One click monitoring configuration using pre-defined alerts
- Smart email notifications based upon the alerts
- Faster reaction time to solve the critical issue
EDB Postgres Enterprise Manager’s (PEM) collects performance and status data from the databases it monitors, from the operating system, and it collects data resulting from jobs it executes on the database host. Data is displayed in dashboards and analyzed for alert conditions. Alerts can be relayed to operators or to other enterprise-level management systems. PEM also allows DBAs and developers to work with the databases directly, execute DDL and DML commands, tune queries, manage indexes, run backups, and deploy software updates.
You will be hearing soon from us on “Are you running your 24 by 7 Database Operations Smoothly?”
Also please drop me a message if there is any further query or you want to add something on the topic. We will be glad to hear from you guys.
Ajay Patel is a Delivery Manager at EnterpriseDB.
Participate in the conversation with Ajay at the user forum Postgres Rocks.