How to Use LCOV for Analyzing the Test Coverage Against PostgreSQL
What is LCOV?
Overview of LCOV and its importance in test coverage
The LCOV (Linux Coverage Visualizer) tool is used for code coverage measurement and visualization. It works in conjunction with another tool, GCC's gcov, to provide a user-friendly way to analyze how thoroughly your tests cover your code.
Here's a breakdown of what LCOV does:
- Leverages gcov data: LCOV relies on data generated by gcov, which tracks which parts of your code are executed during testing.
- Creates HTML reports: LCOV takes this data and transforms it into interactive HTML reports.
- Visualizes coverage: These reports show your source code annotated with coverage information. You can see which lines, functions, or branches of your code were executed by the tests.
- Supports navigation: For large projects, LCOV provides features like an overview page to navigate the coverage data efficiently.
Through the coverage report, you can identify areas where tests on the codebase might be missing and improve your test suite accordingly.
Learn more about setting up tests from the world’s top PostgreSQL experts. Join EDB Postgres Training.
Setting Up LCOV for PostgreSQL
Steps for installing and configuring LCOV for PostgreSQL
Setting up LCOV for PostgreSQL involves installing LCOV and gcov, configuring PostgreSQL to generate coverage data, before generating and viewing the coverage reports. Here's a step-by-step guide.
Step 1: Install LCOV and gcov
On Debian/Ubuntu:
sudo apt-get update
sudo apt-get install lcov
On Red Hat/CentOS:
sudo yum install lcovMake sure you have gcov installed as part of the GCC (GNU Compiler Collection). It usually comes with the GCC package.
Step 2: Build PostgreSQL with coverage support
1. Download PostgreSQL source code:
wget https://ftp.postgresql.org/pub/source/v13.3/postgresql-13.3.tar.gz
tar -xzf postgresql-13.3.tar.gz
cd postgresql-13.3
2. Configure PostgreSQL with coverage flags:
./configure --enable-coverage3. Build and install PostgreSQL:
make
sudo make install
Step 3: Set up and initialize PostgreSQL
1. Initialize the database:
/usr/local/pgsql/bin/initdb -D /usr/local/pgsql/data2. Start PostgreSQL:
/usr/local/pgsql/bin/pg_ctl -D /usr/local/pgsql/data -l logfile startAdditional tips:
- Ensure that your PostgreSQL configuration files (postgresql.conf, pg_hba.conf) are set up correctly for your environment.
- Regularly update your LCOV and PostgreSQL versions to the latest stable releases for improved features and bug fixes.
- Integrate this process into your CI/CD pipeline to automatically generate and review coverage reports for continuous improvement.
Running Tests and Generating Coverage Reports
Instructions for executing tests and generating coverage reports using LCOV
Steps to perform test coverage for any schedule:
1. Cleanup the source under “postgressql” directory.
cd /home/prabhat/PG/PGsrc/postgresql
make clean
make distclean
git clean -fdx
git reset HEAD --hard
2. Configure with "--enable-coverage" option and install.
./configure --with-zlib --enable-debug --enable-depend --prefix=$PWD/inst/
--enable-cassert --with-readline --with-openssl --enable-coverage CFLAGS="-g -O0"; make; make install;
3. Run the schedule (suppose, make check) From /src/test/regress directory.
cd src/test/regress
make check
4. Run the coverage under "/home/prabhat/PG/PGsrc/postgresql" directory.
cd ../../../
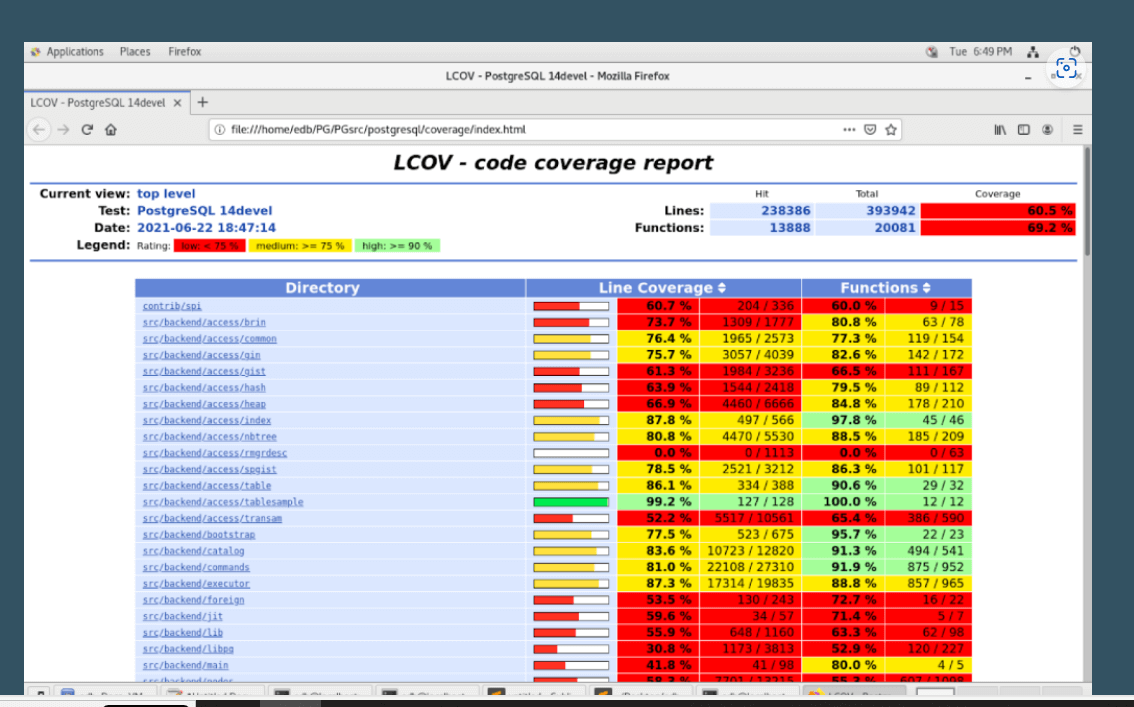
make coverage-html5. Open the index.html in the Firefox browser under the "coverage" directory.
cd coverage/
firefox index.html
Steps to perform test coverage for newly added test cases:
1. Cleanup the source under “postgressql” directory.
cd /home/prabhat/PG/PGsrc/postgresql
make clean
make distclean
git clean -fdx
git reset HEAD –hard
2. Configure with "--enable-coverage" option and install the source.
./configure --with-zlib --enable-debug --enable-depend --prefix=$PWD/inst/
--enable-cassert --with-readline --with-openssl --enable-coverage CFLAGS="-g -O0"; make; make install;
3. Prepare the required test case files. Example:
cd /home/prabhat/PG/PGsrc/postgresql/inst/bin
[prabhat@localhost bin]$ cat /tmp/test.sql
-- Test to demonstrate generate_series.
select x as "col1" from generate_series(1,5) x;
select x as "col1" from generate_series(1,5,2) x;
select x+5 as "col1" from generate_series(1,10,2) x;

[prabhat@localhost bin]$ ./psql postgres -a -f /tmp/test.sql > /tmp/test.out
[prabhat@localhost bin]$ cat /tmp/test.out

-- Test to demonstrate generate_series.
select x as "col1" from generate_series(1,5) x;
col1
------

  1

  2

  3

  4

  5

(5 rows)

select x as "col1" from generate_series(1,5,2) x;

col1

------
  1

  3

  5

(3 rows)

select x+5 as "col1" from generate_series(1,10,2) x;

col1
------

  6

  8

 10

 12

 14

(5 rows)
4. Keep test case files in specific directory under src/test/regress/ (sql, expected)
cd /home/prabhat/PG/PGsrc/postgresql/src/test/regress
mkdir sql/generate_series
mkdir expected/generate_series
mkdir results/generate_series
cp /tmp/test.sql sql/generate_series/.
cp /tmp/test.out expected/generate_series/.
5. Run the test or schedule under "/src/test/regress" directory.
cd /src/test/regress

./pg_regress --temp-instance=/tmp/data1 generate_series/test

Example:
[prabhat@localhost regress]$ ./pg_regress --temp-instance=/tmp/data1 generate_series/test

============== creating temporary instance        	==============

============== initializing database system       	==============

============== starting postmaster                	==============

running on port 58080 with PID 110199

============== creating database "regression"     	==============

CREATE DATABASE

ALTER DATABASE

============== running regression test queries    	==============

test generate_series/test     	... ok       	24 ms

============== shutting down postmaster           	==============

============== removing temporary instance        	==============


=====================

 All 1 tests passed.

=====================
6. Run the coverage under "/home/prabhat/PG/PGsrc/postgresql" directory.
cd ../../../
make coverage-html
Example:
[prabhat@localhost postgresql]$ make coverage-html
/usr/bin/lcov --gcov-tool /usr/bin/gcov -q --no-external -c -i -d . -d . -o lcov_base.info
/usr/bin/lcov --gcov-tool /usr/bin/gcov -q --no-external -c -d . -d . -o lcov_test.info
rm -rf coverage
/usr/bin/genhtml -q --legend -o coverage --title='PostgreSQL 14devel' --num-spaces=4 --prefix='/home/prabhat/PG/PGsrc/postgresql' lcov_base.info lcov_test.info
touch coverage-html-stamp
7. Open the “index.html” in the firefox browser under the "coverage" directory.
cd coverage/
firefox index.html
Analyzing LCOV Coverage Reports
How to interpret LCOV reports, focusing on key metrics and insights
Interpreting LCOV reports involves understanding several key metrics that provide insights into the test coverage of your code. Here’s a detailed look at how to analyze these reports, focusing on the most important metrics and insights:
Key metrics
| Type | Definition | How to Interpret |
|---|---|---|
| Line coverage | The percentage of lines of code that have been executed during testing. | High line coverage indicates that most of the lines in the codebase have been executed by the tests. Aim for high line coverage to ensure comprehensive testing, but remember that 100% line coverage does not guarantee bug-free code. |
| Function coverage | The percentage of functions that have been called at least once during testing. | High function coverage shows that most functions in the code have been tested. This is important for ensuring that all parts of the code are functioning as expected. |
| Branch Coverage | The percentage of branches (decision points like if-else statements) that have been executed. | High branch coverage ensures that all possible paths through the code have been tested, which is critical for finding logical errors and edge cases. |
Detailed insights
| Overall summary | Total coverage: The report typically starts with an overall summary that includes total line, function, and branch coverage. This provides a quick overview of the testing completeness. File summary: Coverage percentages for each file in the project. This helps identify specific files or modules that may need more testing. |
| File-level analysis | Covered and uncovered lines: The report highlights lines of code that are covered (often in green) and those that are not covered (often in red). This visual representation helps quickly identify untested parts of the code. Hits per line: Shows how many times each line of code was executed. Lines with low hit counts may need more testing, especially if they are critical to the application’s functionality. |
| Function-level analysis | Function coverage details: The report shows whether functions were executed during testing. Functions not covered may indicate areas of the code not being tested at all. Hits per function: Similar to lines, this shows how often each function was called. Functions with low hit counts might require more thorough testing. |
| Branch-level analysis | Branch coverage details: This includes information on which branches (e.g., if-else conditions) were executed and which were not. Identifying untested branches can help improve the thoroughness of your tests. Decision coverage: Ensures that all decision points in the code are tested for all possible outcomes. |
Steps to improve LCOV coverage
- Identify coverage gaps
Use the detailed coverage information to find gaps in your testing. Look for lines, functions, and branches that are not covered. - Prioritize critical code
Focus on adding tests for the most critical parts of your application first. These are the areas where bugs are highly detrimental. - Write additional tests
Create tests to cover the untested lines, functions, and branches. This can involve writing new unit tests, integration tests, or end-to-end tests. - Refactor code
Sometimes, complex or hard-to-test code might need to be refactored to improve testability and ensure better coverage.
Best Practices and Troubleshooting Tips
Recommendations for maximizing the benefits of LCOV in PostgreSQL
To maximize the benefits of LCOV for PostgreSQL projects, it's important to follow best practices and be prepared to troubleshoot common issues. Here are some recommendations and tips:
| Ensure proper installation | Verify that LCOV and all necessary dependencies are correctly installed. |
| Set environment variables | Confirm that environment variables like LCOV_HOME are correctly set. |
| Use correct compilation flags | Ensure the --coverage flag is used during the compilation of your source code. |
| Set up paths and directories | Make sure LCOV can access the correct directories for source files and test outputs. |
| Check file permissions | Check for proper file permissions to read and write coverage data. |
| Ensure version compatibility | Use compatible versions of LCOV and GCC. |
| Analyze logs | Review LCOV logs for specific error messages or warnings. |
| Use verbose mode | Enable verbose mode in LCOV for more detailed output to help identify issues. |
| Check for empty coverage data | Ensure that test cases are being executed and generating coverage data. |
| Consult documentation and community | Refer to official LCOV documentation and community forums for additional support and solutions. |
Essential Resources to Enhance Your PostgreSQL Experience
Explore best practices and tools for your PostgreSQL success
Manage Critical Enterprise and Security Requirements
Access Free On-Demand PostgreSQL Courses
6 Telltale Signs It’s Time to Rethink Your Postgres Support
Get 24x7x365 Global Expertise for Your PostgreSQL Database
Build robust, globally distributed PostgreSQL apps
Get full support for open source PostgreSQL with patching, operations, diagnostics, upgrades, performance, and more. Talk to our experts today.
LCOV Code Coverage FAQs
LCOV is a graphical front-end for gcov, the GNU coverage testing tool. It provides a user-friendly way to generate HTML coverage reports, showing which parts of the code have been tested.
For PostgreSQL, LCOV can be used to measure code coverage during testing, helping developers identify which parts of the codebase are exercised by test suites.
Gcov is an open-source code coverage tool that works with GCC to produce coverage results. LCOV is a utility that handles gcov data and presents the coverage report in a more readable and interactive format.
Gcov is a standard utility included in the GNU Compiler Collection (GCC) suite. It provides information on how frequently different segments of code are executed in a program. Gcov produces a copy of the source file annotated with execution frequencies.
LCOV can be installed on most Unix-like systems using package managers. For example:
On Ubuntu/Debian:
`sudo apt-get install lcov`
On macOS with Homebrew:
`brew install lcov`
After installation, ensure that PostgreSQL is compiled with coverage options enabled.
To use LCOV with PostgreSQL, ensure that you have the following:
- GCC compiler with gcov support
- PostgreSQL source code
- PostgreSQL compiled with coverage options (`--enable-coverage`)
- LCOV installed on your system
- Properly configured PostgreSQL build environment
When configuring PostgreSQL for compilation, use the `--enable-coverage` option:
./configure --enable-coverage [other options]
make
make install
This will compile PostgreSQL with the necessary instrumentation for gcov.
After running your tests, use these commands:
lcov --directory . --capture --output-file coverage.info
genhtml coverage.info --output-directory out
This captures the coverage data and generates an HTML report in the "out" directory.
LCOV reports show:
- Overall coverage percentage
- File-by-file breakdown of coverage
- Line-by-line coverage within each file (green for covered, red for uncovered)
- Branch coverage information
- Look for areas with low coverage to identify potential gaps in your test suite.
Test coverage is measured against lines of code, reflecting the percentage of executed lines during testing. For example, if test cases execute 800 out of 1000 lines of code, the test coverage is 80%.
Green lines are fully covered, meaning they were executed by tests.
Red lines are not covered, meaning they were not executed by tests.
Yellow lines are partially covered, indicating conditional statements where only some branches were tested.
Gcovr serves as a command-line alternative to the LCOV utility, running gcov and generating HTML-formatted reports. Gcovr was developed to address the need for text summaries and XML reports.
Yes, LCOV can be used for PostgreSQL extensions. Compile the extension with coverage options, run your tests, and then use LCOV to generate reports specifically for the extension's source files.
Yes, there can be performance impacts:
- Compilation is slower due to additional instrumentation
- Runtime performance may be slightly degraded
- Additional disk space is required for coverage data files
- These impacts are generally only significant in development/testing environments.
Use the `--exclude` option with lcov command:
lcov --directory . --capture --output-file coverage.info --exclude '/usr/include/*' --exclude 'test/*'
This example excludes system headers and test directories.
Use the `lcov --add-tracefile` option to merge multiple coverage data files. For example:
`lcov --add-tracefile coverage1.info --add-tracefile coverage2.info --output-file merged_coverage.info`
- Automate coverage report generation as part of your CI/CD process
- Set coverage thresholds and fail builds if they're not met
- Archive coverage reports as build artifacts
- Track coverage trends over time
- Use LCOV's ability to combine reports from multiple test runs for comprehensive coverage analysis
- Ensure that you compile your code with the appropriate coverage flags (-fprofile-arcs -ftest-coverage).
- Verify that you are capturing coverage data from the correct directory.
- Make sure that the .gcda and .gcno files are generated and accessible.