Benchmarking PostgreSQL: Overcoming an Unexpected Bottleneck

In my previous blog post, we noted that the PostgreSQL benchmarks were measured in NOPM (New Orders Per Minute) instead of TPM (Transactions Per Minute). This means that we are free to create transactions on the database without affecting the results of the benchmark. The activity we create may influence the benchmark, so we shouldn’t go running billing reports or whatnot—but we can add a little bit of monitoring. Why not?
I set up a cron job to save off pg_stat_activity every minute. A slightly simplified version of it looks like this:
psql -c "COPY (SELECT now(), * FROM pg_stat_activity) TO STDOUT" >> psa.datAt the beginning of the benchmark, I delete that file, and at the end, I copy it over to my results folder. Then I am free to import it into Postgres (what else?) like this:
CREATE TABLE activity (
    ts timestamp with time zone,
    LIKE pg_stat_activity,
    PRIMARY KEY (ts, pid, backend_start)
);
\COPY activity FROM psa.dat
Now we have crude monitoring for all the activity over the course of the two-hour benchmark. We could use a real monitoring tool, of course, but sometimes it’s fun to do some quick and dirty hacking that works just as well. Especially when we want self-contained results to look at later.
Here is what I found throughout the month of February when I aggregated all the different wait events (all benchmark runs combined):
| Type | Wait Event | Count | % |
|---|---|---|---|
| LWLock | XactSLRU | 1,360,047 | 35.32 |
| LWLock | WALWrite | 886,523 | 23.02 |
| \N | \N | 385,186 | 10.00 |
| LWLock | BufferMapping | 300,717 | 7.81 |
| LWLock | XactBuffer | 252,656 | 6.56 |
| Client | ClientRead | 155,588 | 4.04 |
| IPC | XactGroupUpdate | 116,991 | 3.03 |
| LWLock | WALInsert | 87,827 | 2.28 |
| IPC | ProcArrayGroupUpdate | 64,000 | 1.66 |
| LWLock | BufferContent | 51,783 | 1.34 |
| Lock | extend | 50,975 | 1.32 |
| Lock | transactionid | 50,776 | 1.31 |
(The \N represents null, or no waiting. Only locks exceeding 1% are shown.)
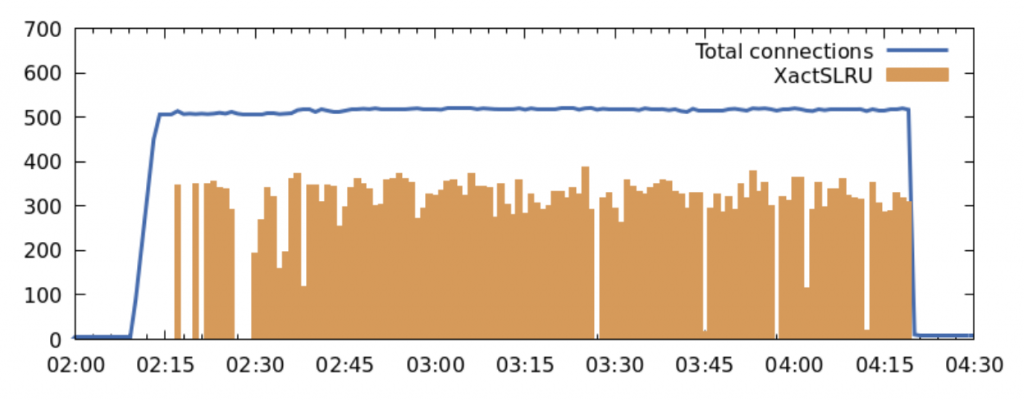
I was expecting to see maybe relation extensions on top of the list because even though there are optimizations in Postgres to extend tables by a lot when there are a lot of concurrent inserts, there is no such optimization for indexes. But those amount to a measly 1.32%. What I found instead is that over a third of the time is spent waiting to access the Commit Log!
The commit log (or clog, I pronounce it cee-log) holds the status of each transaction. That is: whether it is still running, rolled back, or committed. Every query needs to examine this in order to determine the visibility of every row it looks at. For more information, see the official documentation for Concurrency Control.
Here is a graph of one of the runs, showing the number of total connections and the number of connections waiting to access the clog.
Can anything be done to improve this? I think it’s worth looking into.
The Results
Here are the results I got over the month of February for what I call The Daily 500; a single 2-hour TPROC-C run of 500 users on the first commit of the day UTC.
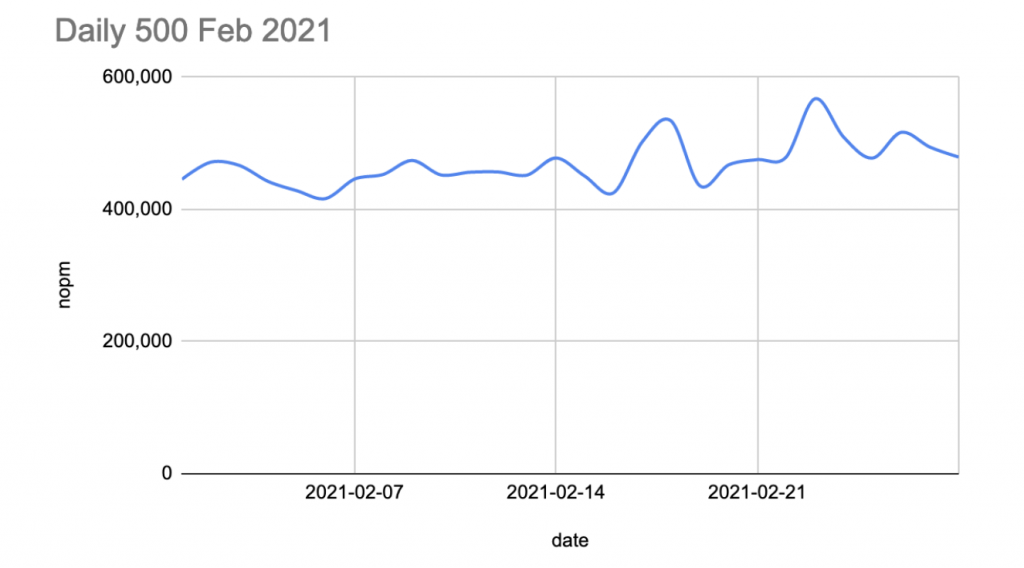
The average NOPM improved towards the end of the month. This is due to some Linux kernel tuning on the 22nd, which I’ll talk about in a future blog post!