

Using multiple-node EDB Postgres Distributed (PGD) is an easy lift to ensure you minimize downtime and keep data close to your users, especially for critical databases running on Postgres where application unavailability can cost your business by the second. This article walks you through one way to monitor a PGD cluster directly within BigAnimal’s Superset, leveraging the internal metadata database to make sure your deployments are healthy.
EDB Postgres Distributed (formerly BDR) is an asynchronous multi-master replication system for PostgreSQL that helps you maintain your application’s availability during planned and unplanned outages. PGD turns high availability into extreme high availability with its multi-master architecture. It eliminates a single point of failure and expands access to near real-time data across geographically distributed systems.
Of course, as with any database, you’ll want to monitor your replication to ensure that your system performs optimally and does not run out of disk space or encounter other issues. Operationally, it is important to have automated monitoring and visualization in place to ensure that if, for example, replication slots start falling badly behind, the administrator is alerted and can take proactive action.
To help monitor your database, we recommend using Apache Superset. We highly recommend checking out the EDB blog on Superset to see how it integrates with EDB BigAnimal, our fully-managed Postgres cloud offering. Below are the steps for creating a Superset Dashboard for configuring the EDB Postgres Distributed dashboard after setting up a PGD cluster in the BigAnimal portal.
Configuring an EDB Postgres Distributed dashboard
We provide a template for an EDB Postgres Distributed dashboard in JSON format (`utils/superset/pgd_monitoring_template.json`) in the cloud-utilities repository. The JSON file includes the schema of the dashboard and the individual charts.
- Clone the cloud-utilities GitHub repository on your local machine.
git clone git@github.com:EnterpriseDB/cloud-utilities.git
- Use the following syntax to create an output JSON file. The script is on path `utils/superset/db_name_change.py`. Change your working directory accordingly.
cd cloud-utilities/utils/superset
Give executable permission to the script
chmod +x db_name_change.py
Now run the script
./db_name_change.py <database_name> -i pgd_monitoring_template.json -o <output_file>
For example:
./db_name_change.py edb -i pgd_monitoring_template.json -o upload.json
Note that you need to match the database name entered in the superset.
To get more information on the db_name_change script, run
./db_name_change.py -h
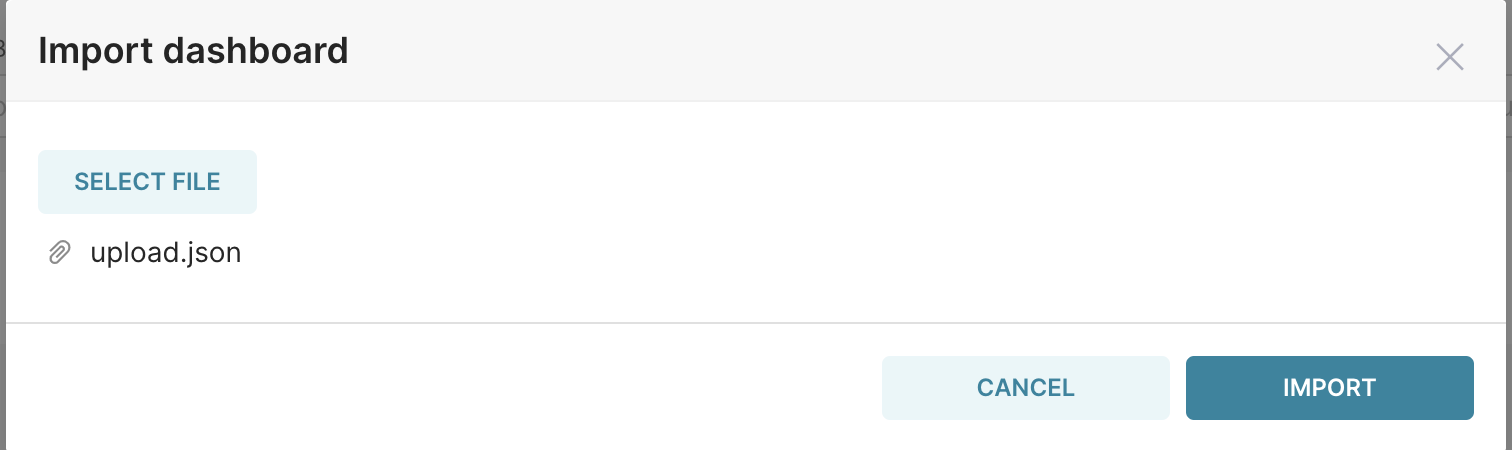
- In Superset, import your output file by selecting Analyze > Dashboards > Import dashboard.
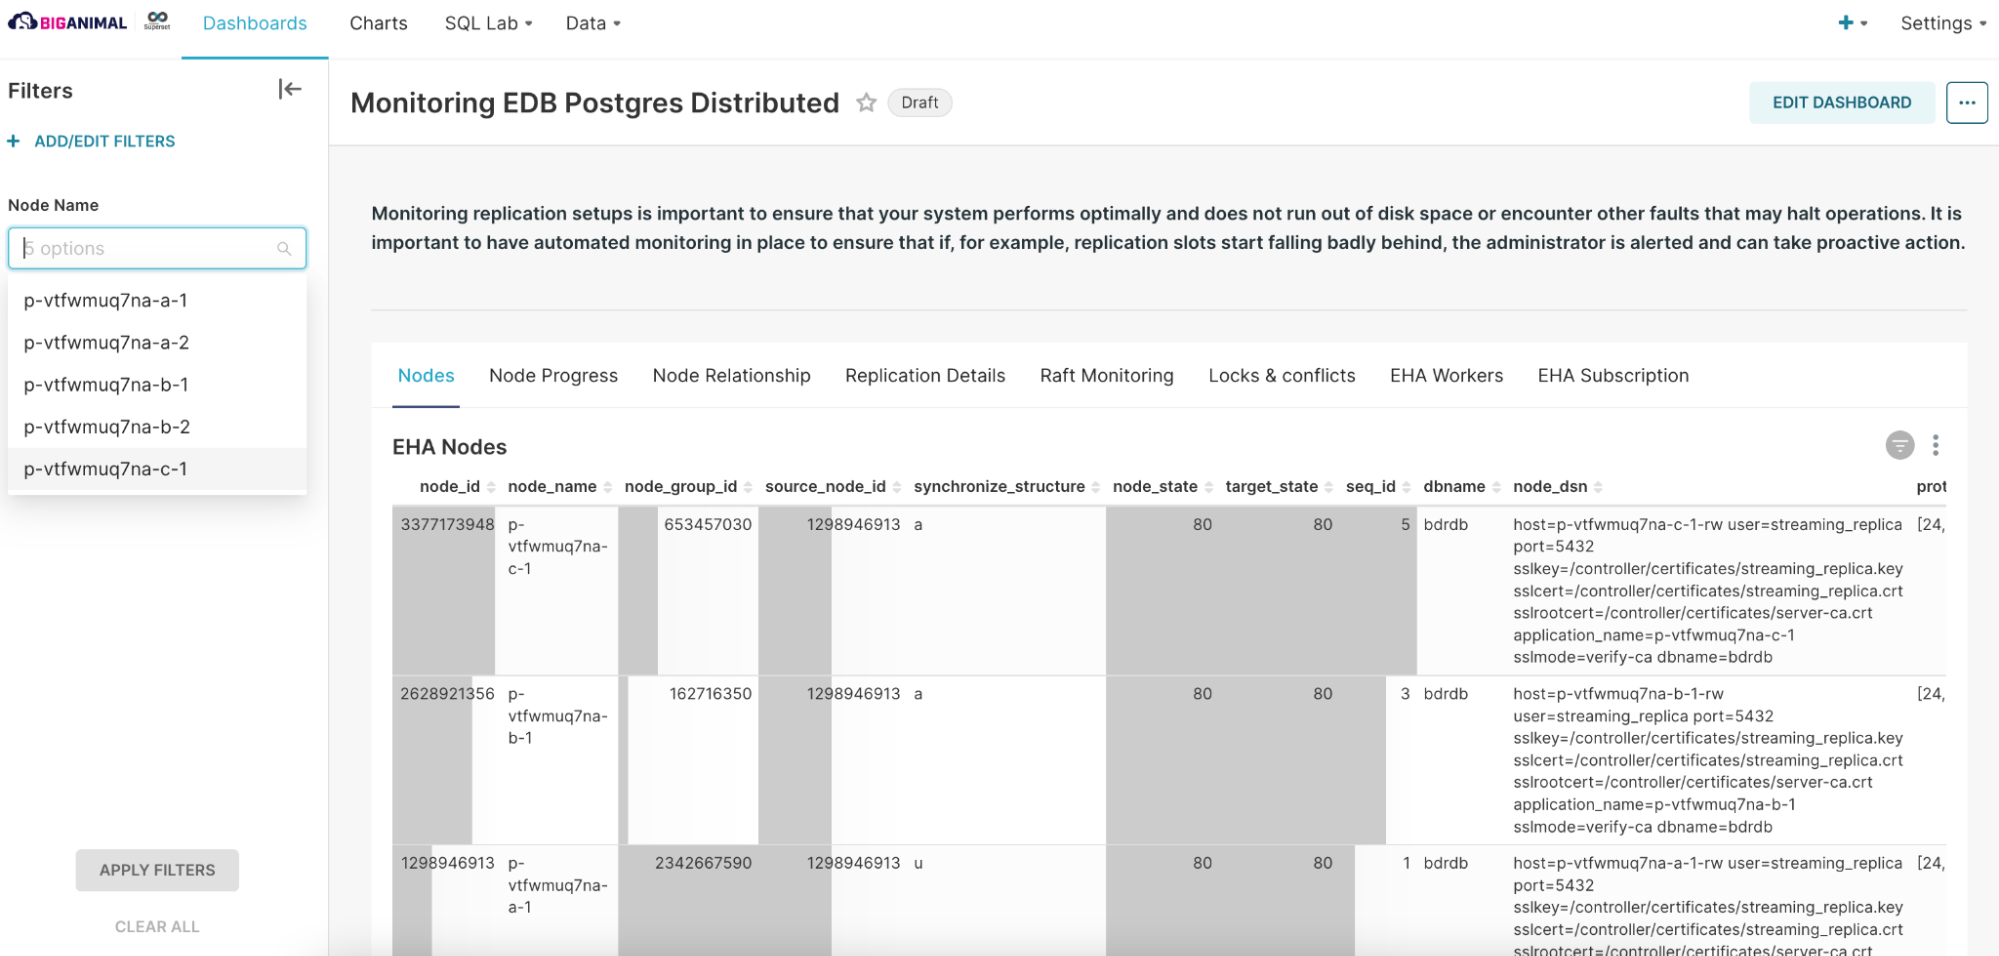
- Now onto the fun part! Once the import is successful, you are ready for action. We jumped into having a holistic visualization of EDB Postgres Distributed nodes and real-time data, bringing them together in an interactive dashboard with minimal effort and settings, as shown in a screenshot below.
Diving deep into the Superset dashboard
You can see that charts on the dashboard are aligned in multiple tabs. You can navigate to an individual tab by clicking on it (Of course, you can also rearrange and add/remove charts). Let’s dissect how some of the charts are defined:
Nodes
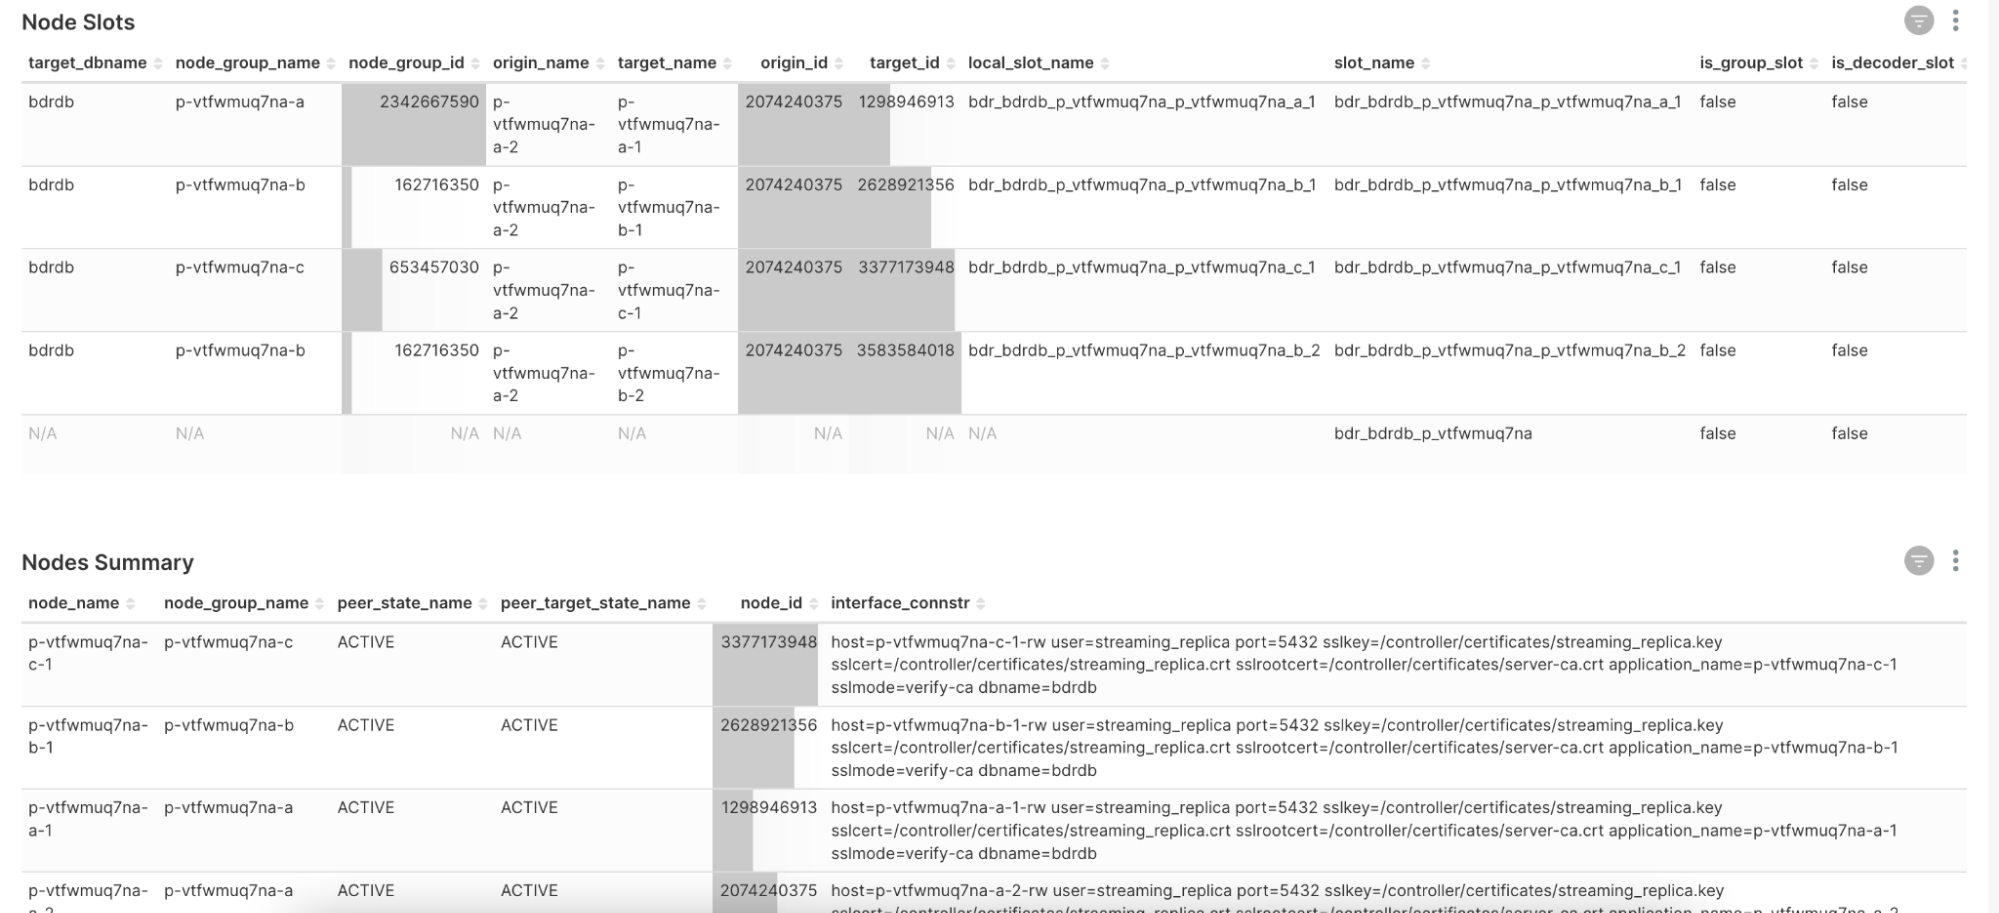
The node slots and node summary are the two main views used for monitoring the nodes.
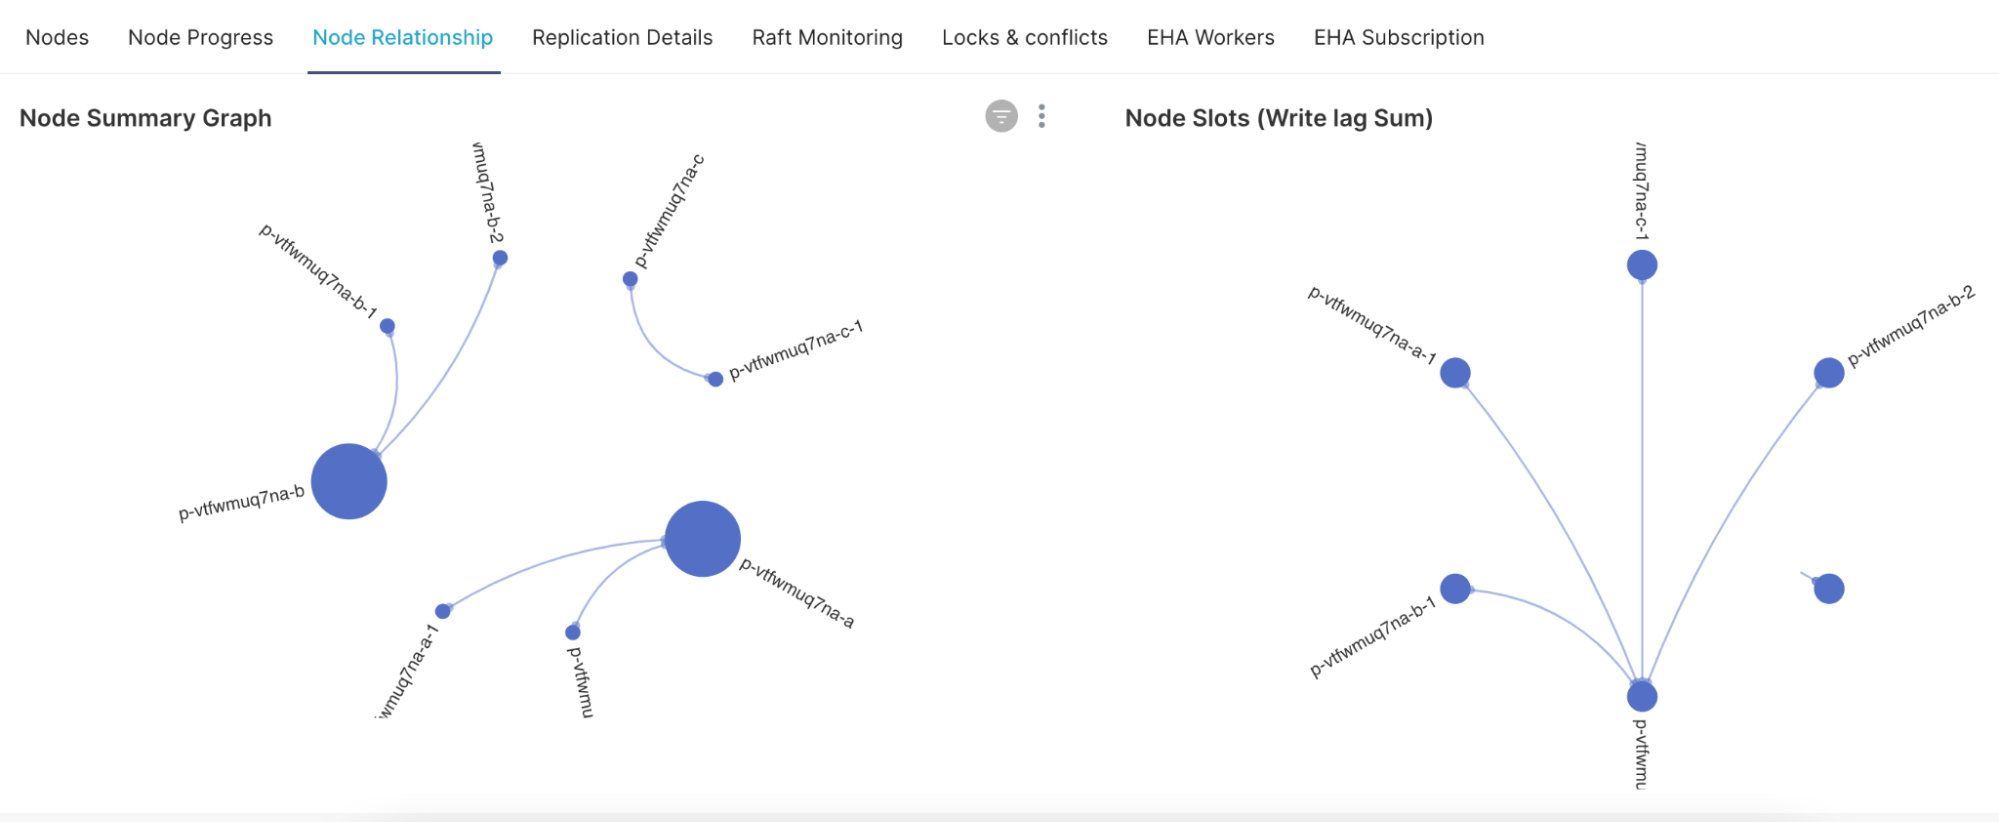
Node Relationship
The graph chart visualization in Superset lets you visualize many-to-many relationships between nodes that would be otherwise difficult using traditional plots.
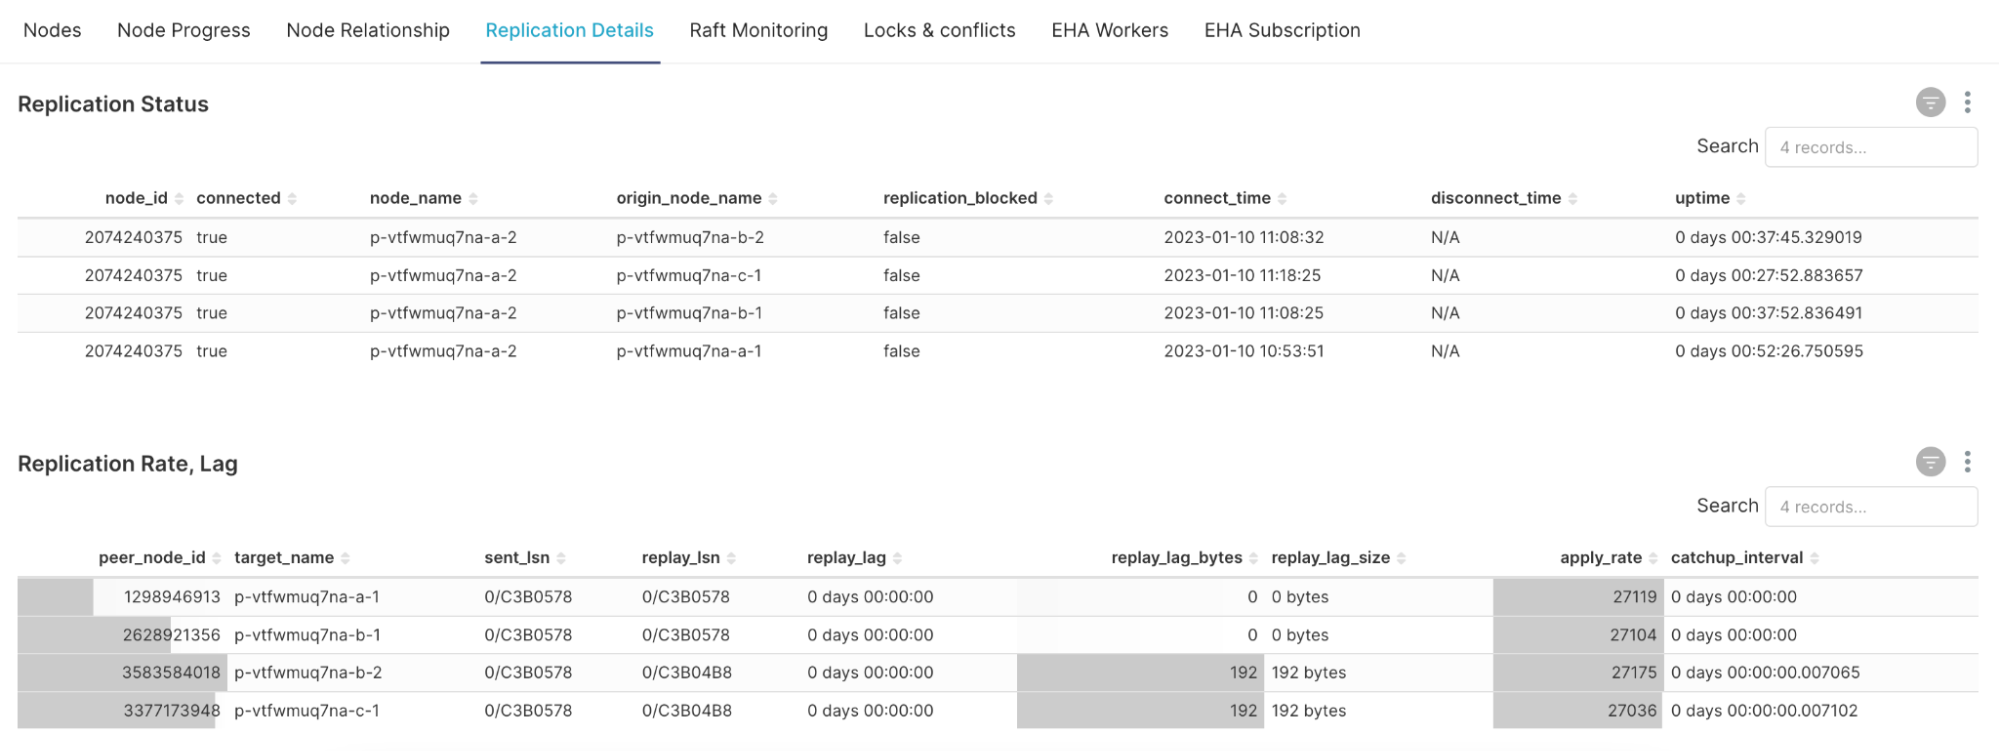
Replication Details
Replication monitoring is essential for a mission-critical workload. The charts of replication status and replication rates are aesthetically pleasing and can help us obtain a quick overview of replication details for monitoring outgoing replication activity.
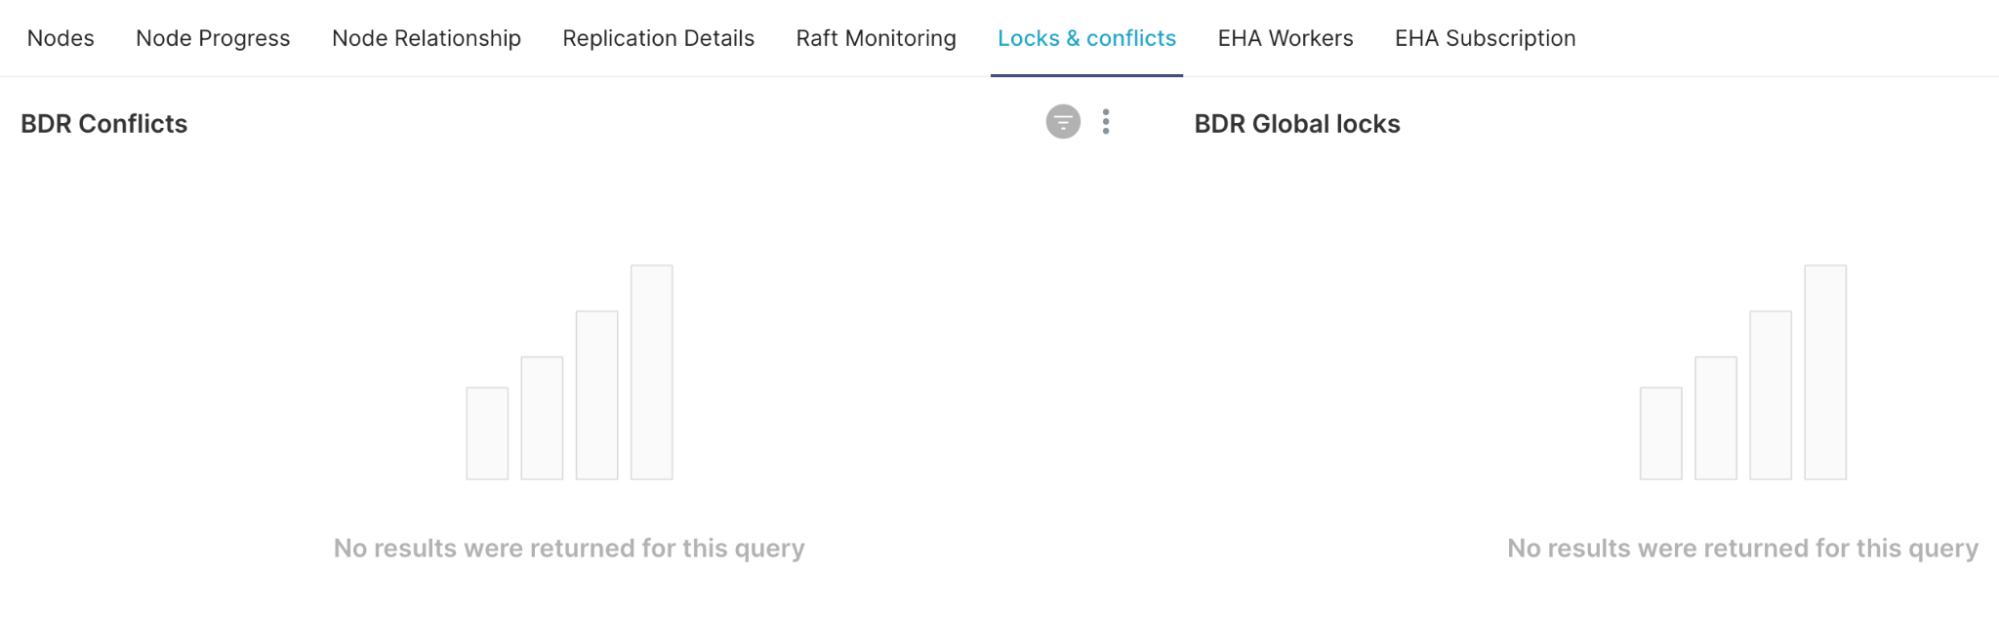
Locks & Conflicts
Replication conflicts can arise when multiple nodes make changes that affect the same rows in ways that can interact with each other. The PGD system should be monitored to ensure that conflicts are identified and, where possible, application changes are made to eliminate them or make them less frequent. No PGD conflicts should be the ideal situation for any engineering team, just like the screenshot below depicts.
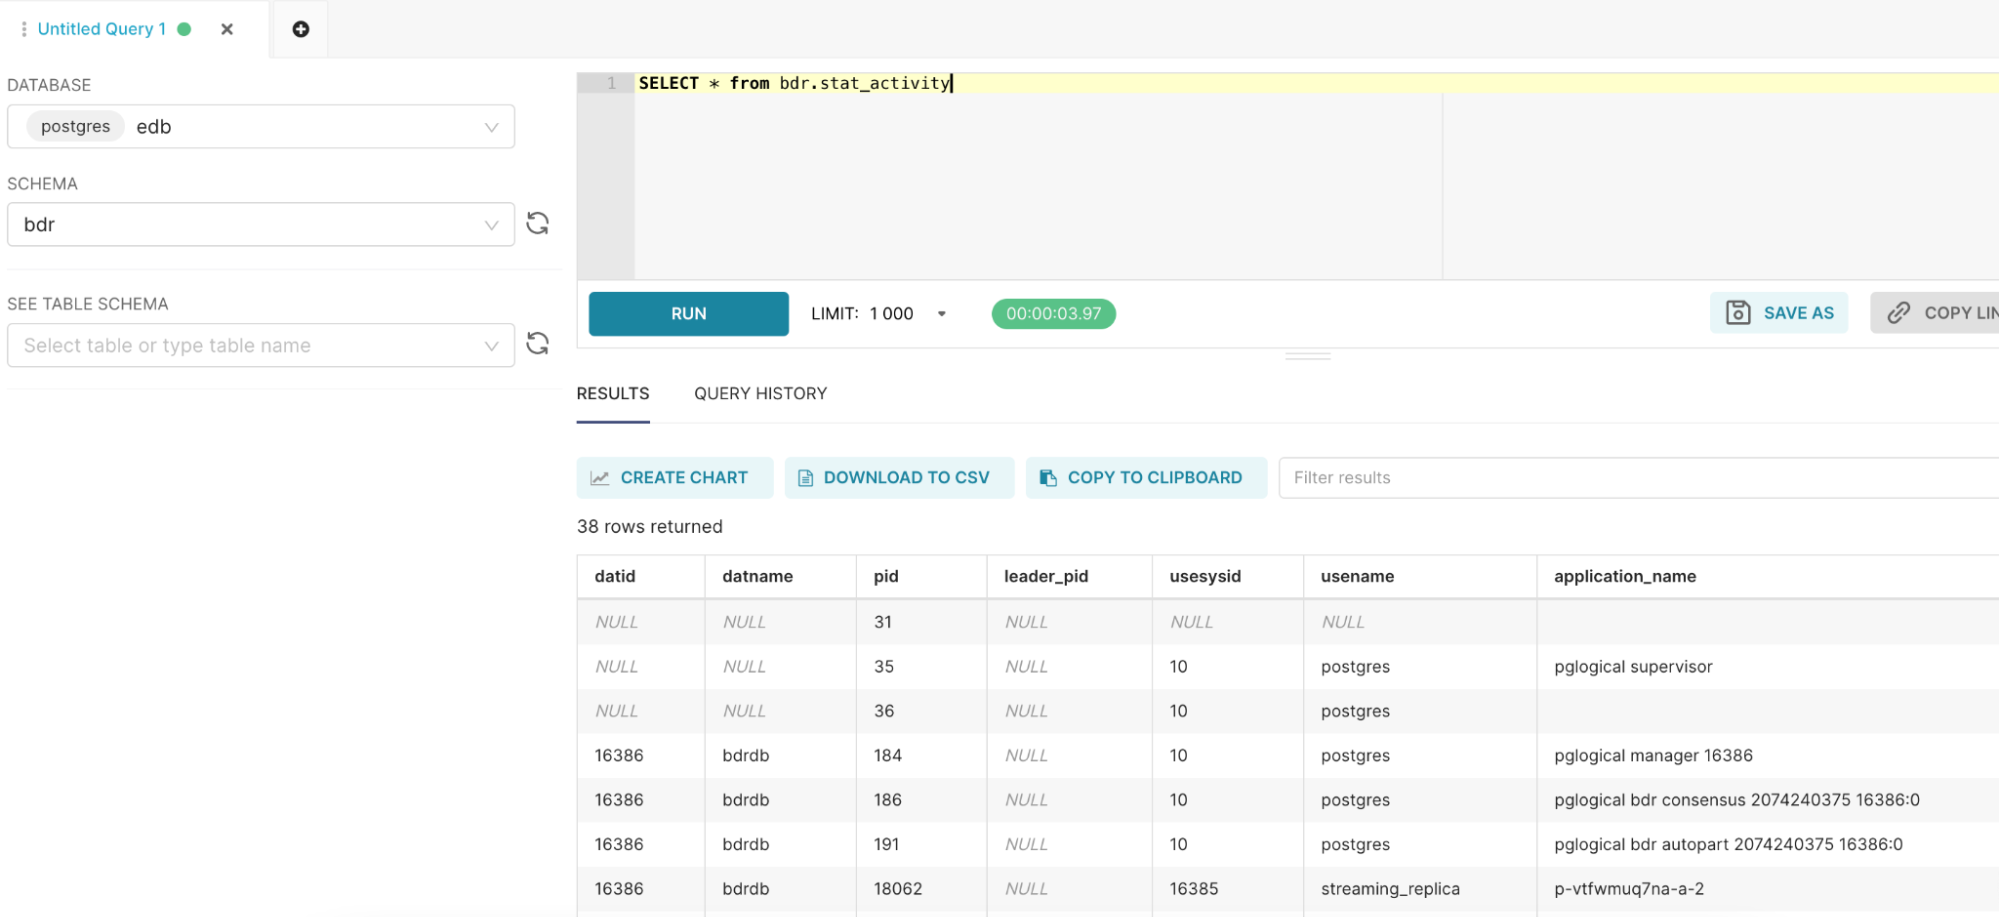
The individual charts in the dashboard will provide you with even more granular information for further action classification. You can even run multiple queries and explore data by setting up metrics, columns, time ranges, etc. on SQL Lab > SQL Editor.
We hope that you have enjoyed this blog and that this piece of information will help you build informative and useful visualizations. We encourage you to spend some time in the docs and explore other features of Apache Superset. To enable Superset for your BigAnimal organization, contact BigAnimal Support.