
Finding (and Fixing) a Silent Throughput Ceiling in PostgreSQL

“A benchmarking case study on relation extension locks, partitioning, and peak write load”; I gave this talk at PG Pune 2026, a community Postgres event with about 170 attendees, mostly database engineers, DBAs and Postgres enthusiasts. This post is the written version, plus two questions from the audience. Under heavy write load, I ran into a throughput saturation in Postgres. More CPU, more RAM and faster disks did not move it. The servers looked healthy the whole time. Here is how it showed up in my benchmark, what caused it, and the change that gave me 7.2x the throughput on the same hardware.
1. The Setup
I used HammerDB's TPROC-C workload, which is based on TPC-C, against vanilla community PostgreSQL 18. HammerDB is free and open source and is backed by the TPC Council. TPROC-C is its OLTP workload and TPROC-H is its OLAP one. Two numbers come up throughout: NOPM (New-Order Transactions Per Minute) and TPS (Transactions Per Second). I wanted to mimic the traffic of an e-commerce peak, so I used 50 warehouses and 64 virtual users, all inserting rows at once in bursts, into HammerDB's default TPC-C schema (District, Order, Stock, Customer, History). For the baseline, every worker wrote into one unpartitioned schema. That is the worst case for lock contention, because every write goes through a single file:
diset tpcc pg_count_ware 50 diset tpcc pg_num_vu 64 diset tpcc pg_partition false diset tpcc pg_storedprocs true vuset vu 64 vurun
2. What The Logs Revealed
Under load, sessions started stalling. The Postgres log told me why: 2026-08-05 07:28:51.695 UTC [71429] LOG: process 71429 still waiting for ExclusiveLock on extension of relation 20153 of database 20032 after 1000.035 ms
That's the relation extension lock, reported as Lock:extend. It only appeared in the log because the wait went past deadlock_timeout (1000 ms by default). Nobody wrote this message for this problem. Nothing in the extension code says "too many backends are extending this table". The line comes from the Postgres lock manager, which reports any lock wait that runs past deadlock_timeout, whatever the lock is for.
3. The Impact: Creeping Latency
I scaled the virtual user load from 64 to 128 on the unpartitioned schema, basically doubling the clients – expecting throughput to dip a little. It fell off a cliff. NOPM dropped from roughly 400,000 to roughly 52,000. At 128 VUs I saw more than 75 backends queued behind the one extension lock, and the longest single wait was 6.7 seconds. For one insert, that is a very long time to wait for a page. Nothing crashed and I lost no data. What I got was a ceiling, a throughput saturation. It shows up as slow responses and full connection pools right when traffic peaks. That is what makes it dangerous: you don't see it until the worst moment. The monitoring dashboards looked fine. The vCPU sat at 35% and disk latency stayed under 1 ms, yet Scenario 1 was stuck at a flat 3,400 TPS. It was a very calm kind of disaster. Nothing was short of resources, so I had to find out what was holding things back.
4. Under the hood: The Relation Extension Lock
When a table grows, a backend has to append a new page to it, and two backends must never claim the same new block. Postgres prevents that with an ExclusiveLock during relation extension. This isn't a flaw. It's a safeguard, and here's why it has to exist. The lock itself is mundane and is held for a very short time. It only hurts when many backends line up for it at once. Without it, backend A checks the table size, sees block 42 is free and starts writing row X. Backend B does the same check, sees block 42 free too, and starts writing row Y. Both think the block is theirs, and one row can be lost. With it, backend A takes the lock, writes row X to block 42 and releases it. Backend B waits briefly, then gets block 43. The lock turns "check size, then append" into one step, so both rows survive. So any fix has to keep that guarantee and can't work around it.
5. Why Hardware Scale-up Fails
My first instinct was to throw hardware at it. I re-ran the same benchmark with more vCPU and faster NVMe. Throughput changed by 0%. Not a little. Zero. The database did not care how nice my servers were. The ceiling is a software lock, not a hardware limit. Faster storage finishes each extension sooner, but every other session still waits in the same single queue. More hardware was never going to move this number, and reaching for a bigger instance would have been dreadfully wrong.
6. The Fix: Partitioning
For Scenario 2 I ran the identical workload with one change: hash partitioning on the hottest table, which spreads inserts over 10 sub-partitions instead of one file. diset tpcc pg_count_ware 50 diset tpcc pg_num_vu 64 diset tpcc pg_partition true <- the one flag that changes between scenarios diset tpcc pg_num_partitions 10 vuset vu 64 vurun
This turns one heavily contended extension lock into several independent ones, one per partition, so the table can handle more concurrent writers. It doesn't remove lock contention. Each writer just waits in a much shorter line. On the HammerDB side the change is just one flag, pg_partition true.
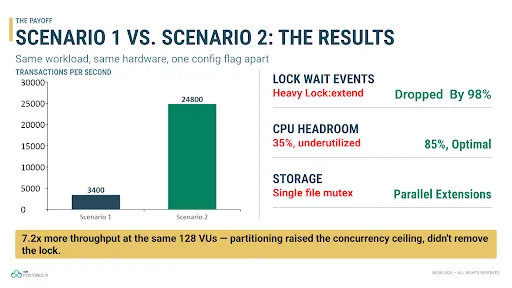
Same hardware, same VUs: partitioning cuts lock waits and lifts throughput 7.2x.
| Metric | Scenario 1 (unpartitioned) | Scenario 2 (partitioned) |
| Lock wait events | Heavy Lock:extend | Dropped 98% |
| CPU headroom | 35%, underutilized | 85%, optimal |
| Storage | Single file mutex | Parallel extensions |
7.2x more throughput at 128 VUs. Partitioning raised the concurrency ceiling, it didn't remove the lock.
7. The Catch: Partition Key Matters
I had 10 partitions either way, but whether writes actually spread across them depends on the partition key. The key is not only a query design choice. It also decides which lock each writer ends up waiting on.
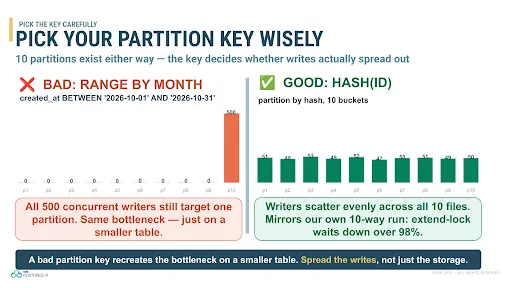
Choosing a hash key spreads writes evenly across partitions; a bad range key concentrates them on one.
A bad key quietly sabotages the whole exercise and brings back the original bottleneck on a smaller table. What you want is to spread the writes, not only the storage.
8. A Mental Model: Worth Analogy
The way I think about it: one file with one lock is one runway handling every aircraft. Everything funnels through the same runway. Partitioning adds a second parallel runway. The traffic is the same, but it's split across parallel paths. The analogy holds up well beyond that:
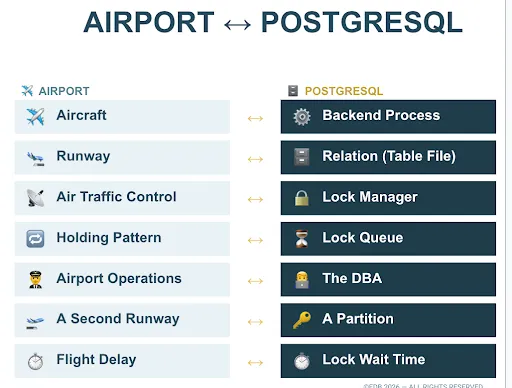
Airport ↔ PostgreSQL: the runway analogy mapped to lock concepts.
DBAs, to check whether your own table is in a holding pattern, run this: SELECT pid, wait_event_type, wait_event, query FROM pg_stat_activity WHERE wait_event = 'extend';
If it returns rows, backends are already queued on the lock, like aircraft stacked up waiting for a runway.
9. Why This Matters In Production
This isn't a crash and it isn't corruption or core dump. It's a response-time problem, and it hurts most at peak traffic, when the write volume that triggers it is highest. Most teams never see it coming until peak traffic finds it for them. A slow p50 annoys users. A blown-out p99 loses them. In a low-latency, mission-critical system, a lock wait on relation extension isn't just a database metric. It is a direct line to revenue and reputation. It is also a silent outage. Nothing is down, but a customer is staring at a spinner in the middle of a financial transaction, a flash sale or a ticket drop. That is the worst moment to find out you have this problem. The fix is small. Something that would have shown up as a Black Friday outage can become a Tuesday-afternoon config change, if you catch it early. A single benchmark is only an anecdote, so please test this on your own workload before you take my word for it.
10. Questions from the room
Two questions from the audience are worth adding here, because they get at points the talk only hinted at. One question was whether this was really an infrastructure problem, and whether more scaling or a different environment would have fixed it. It wouldn't have: more vCPU and faster NVMe changed throughput by 0%. The fix was a database change, partitioning the hot table. It raised the ceiling and also let the system absorb more concurrent write load before hitting the same wall. Another was whether partitioning slows reads down. It can, depending on the query and the partition key. I think it's worth the trade-off: a slightly slower cross-partition read is a fair price for a write path that no longer collapses at peak.
Takeaways
- Monitor the wait event, not just resource metrics. The CPU and disk looked fine the whole time. Check
pg_stat_activityforwait_event = 'extend'and catch this before your customers do. - Partition for concurrency, not just cleanup. More files means more locks and more headroom. It raises the ceiling without removing it, and the partition key decides whether the headroom is real.
- Measure before you scale hardware. This bottleneck doesn't respond to more CPU or faster disk. Benchmark first.
Conclusion
One last thing: don't ignore the warnings in your logs. A single line, "still waiting for ExclusiveLock", sat there while the dashboards stayed calm, and it was the only thing telling the truth. Postgres will usually tell you when something is wrong. You just have to read it before peak traffic reads it for you. A problem you can't see isn't a problem you've solved. It's a problem waiting for your worst day to introduce itself.