PG Phriday: Addressing Demands of Highly Available OLTP Environments

What do you think of when you encounter the acronym: OLTP? We all know the acronym stands for Online Transaction Processing, and probably equate that with “lots of transactions”. But how many is that? 100 transactions per second? 1,000? 10,000? Even more? Simple pgbench benchmarks may reach over 100,000 TPS, and more sophisticated ones like TPROC-C can flirt with 40,000 TPS.
Disrupting this kind of throughput is generally extremely visible on the application side, resulting in a worse Recovery Time Objective (RTO) than required. Let’s explore a real-world example of a financial institution which had to tackle this issue while handling about 35,000 TPS at peak. This environment measured downtime in financial options trades which could potentially represent exchanges worth millions of dollars each, and as a consequence, the Recovery Point Objective (RPO) was zero at all times.
This article will cover a bit of what we did to minimize the impact of an unexpected failover event, and how we might have improved the situation for the future.
A common design
Let’s start with what is a very common deployment pattern in many industries. It starts with one or more application servers handling any number of client requests. All requests are routed through some kind of Proxy to abstract from the Postgres layer so we can manage switchover and failover events without reconfiguring the application servers. The Postgres layer itself consists of two Postgres servers and a Witness to enable quorum-safe Primary node elections so we can avoid Split Brain, Network Partition, or other undesirable situations associated with data layer abstraction.
It looks something like this:

This particular environment used two of these deployments, each in a separate Data Center within the same geographic Region, with standard Postgres physical streaming replication to the Disaster Recovery location.
The hardware was also top-of-the-line for the early 2010s, consisting of PCI-E NVMe storage rated at 250,000 4k IOPS, the latest Dual Xeon 14-core CPUs, 64GB of RAM, and direct 10GB dedicated network channels between the Postgres servers to optimize replication. It was eye-wateringly expensive, especially given the Disaster Recovery deployment was almost entirely idle most of the time.
The problem of cold storage
Once we optimized the instances, Postgres had no trouble handling 35,000 sustained mixed read/write TPS all day long. For those keeping track, that’s over one billion transactions over the course of an 8-hour day. The first semi-intractable issue we encountered was actually the reason we switched storage to the NVMe drives in the first place: cold starts. I presented our struggle with this issue at Postgres Open 2011.
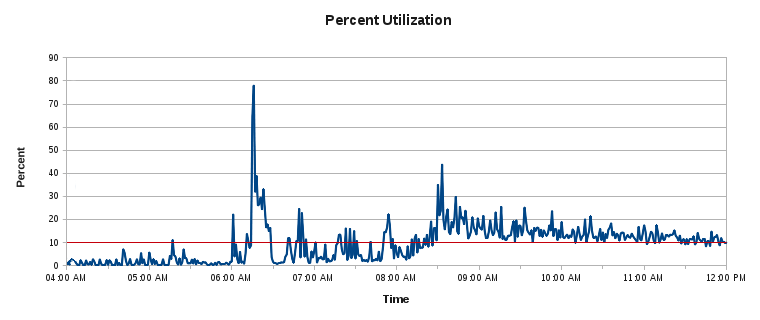
This is a graph based on sar storage utilization data gathered in 1-minute increments from the original 10-disk RAID-10 following a Postgres service restart:

Those spots where it caps out at 100% is where TPS would often fall to a fraction of the amount necessary to fulfill client requests. The front end was designed to abort any client request that exceeded 10 seconds to prevent excessive waits. Such failed requests meant one or more subsequent attempts and angry customers. During those periods where IO is fully saturated, the front-end would drop up to 90% of all incoming requests due to timeouts.
All of this was because the Postgres Shared Buffer cache was cleared upon restarting the service. The filesystem cache still exists, but not at the necessary level of granularity. Blocks read often enough from Shared Buffers are never refreshed at the filesystem cache level, meaning those blocks are largely irrelevant once Shared Buffers are firmly established. As a result, any subsequent read becomes a cache miss, and then a request to the underlying (and antiquated) spinning rust.
After acquiring and installing the FusionIO NVMe devices, the IO graph looked more like this:
An improvement to be sure, but was there another option?
Enter pg_prewarm
Short of throwing money at the problem this way, what could we have done? Unfortunately for us poor souls in 2011, not much. The pg_prewarm contributed extension introduced in Postgres 9.4 makes it possible to record periodic snapshots of the state of the Postgres Shared Buffers. If set in the shared_preload_libraries parameter, any blocks previously within Shared Buffers will be faithfully reloaded upon a restart.
This may not be enough, however. Even with pg_prewarm, any outage in the middle of the day requires a lengthy warming period to retrieve these blocks from storage. It’s much faster to do this before introducing query traffic, otherwise the additional randomized IO will require hours to reach normal operation rather than 5-10 minutes. Is 5-10 minutes of downtime better than 2-3 hours of 20-30% client-side timeouts? The win here isn’t as obvious as things may seem, but the former is generally preferable. Unfortunately, that’s dropping firmly out of 4-9s of availability (only 4 hours of outage per month) after a single occurrence.
There’s also the aspect of the Standby Postgres server. Unlike the Primary, it cannot benefit from this kind of Shared Buffer bootstrapping, because it does not receive write traffic, and in our particular configuration, no read traffic either. This means any database failover always results in reading all data straight from underlying disks rather than warmed filesystem cache or Shared Buffers.
The pg_prewarm extension does provide syntax to load specific tables into Shared Buffers. Provided a list of all consequential tables—or at least those associated with the critical “Morning Open” period—it could mitigate the worst of the activity spikes. To best utilize this would mean aggressive data partitioning by date. This makes it possible to preload the most recent (and relevant) data, rather than an entire 300GB table and hoping for the best.
It also only really scratches the surface.
Opportunistic caching
It’s extremely common in modern application stacks to utilize asynchronous page blocks and Javascript or TypeScript to manipulate the HTML Document Object Model (DOM) on live pages. Even if we ignore sophisticated front-end caching like CloudFlare and other Content Delivery Networks (CDNs), that still means perceived downtime can be greatly reduced.
How? Each relevant page block can operate from a different underlying data-set that’s governed by an individually distinct set of rules. Consider this content grouping:

Each of these content areas is its own asynchronous backend call to a queue-driven request system. It makes a request to the client API, which then enters a queue layer, which then hits a cache system, and if it can’t provide the result, it becomes a database query. During that whole interaction, only one of those five blocks may be displaying a “loading” icon, while the rest remain fully interactive through separate requests.
The system we used had all of those parts except the cache. Thus every front-end interaction translated directly into a database query. There is another extension called pg_stat_statements that gathers aggregate information about all queries being executed within a Postgres instance. The most common use case is to find queries in need of optimization, but it also serves to identify ideal cache candidates.
The best part is that it’s incredibly easy to use. Just ensure the shared_preload_libraries configuration parameter includes the pg_stat_statements library:
shared_preload_libraries = 'pg_stat_statements'Restart Postgres if the extension wasn’t already part of that parameter. Then execute this SQL in any database where pg_stat_statements should be enabled:
CREATE EXTENSION pg_stat_statements;And then use a query like this to find the overall query execution totals after the extension has had a few hours or days to accumulate usage statistics:
SELECT substring(query, 1, 40) AS query_part, calls, round(calls/sum(calls) OVER () * 100) AS call_percent FROM pg_stat_statements ORDER BY calls DESC;In our particular case, queries to the login and account tables represented about 90% of all statements. Those tables were orders of magnitude smaller than the rest, and cache invalidation based on account changes or login refreshes would have been relatively easy to maintain.
A proper cache layer could have prevented the need for a FusionIO device in the first place. In situations where doing this would not require substantial invasive modifications to the underlying application architecture, it’s an easy choice.
Three amigos
Another important aspect is the fact that any critical Postgres deployment should have three nodes. Our implementation relied on two nodes per location and a Witness through the Pacemaker stack. This was only possible because we got synchronous replication through a Distributed Replicated Block Device (DRBD) layer. This kind of deprecated approach has its pros and cons, but can also be the source of several technical hurdles.
A better way to implement safe synchronous replication instead is to swap the Witness node with a full Postgres replica. Then we can do this in the configuration file:
synchronous_commit = 'remote_write' synchronous_standby_names = 'ANY 1 (standby1, standby2)'And when setting primary_conninfo, we simply need to name each Standby appropriately, like so:
primary_conninfo = 'host=primary user=rep_user application_name=standby1'Afterwards, each transaction will only commit if at least one of the two Standby systems acknowledges and writes the transaction locally. Since there are two Standby nodes, we can take either offline for maintenance or routine upgrades. Transactions will also continue in the event a Standby goes offline unexpectedly.
Whenever this is done, it’s important to use a reliable failover management tool such as repmgr, EFM, or Patroni. This ensures nodes are properly rotated during switchover and failover events, while maintaining the synchronous replication configuration. These components also prevent Split Brain through various Fencing and connection routing approaches, and in some cases can even resynchronize or rebuild nodes on demand.
A persistent proxy
Database proxies fulfill several roles.
- Client connection routing
- Abstraction layer from physical database nodes
- Connection multiplexing / pooling
The most prominent of these in regard to Postgres is currently PgBouncer, though it’s not uncommon to use something more volatile such as a Virtual IP address or even a CNAME. What’s important is that this abstraction exists to decouple the application from the database layer in a configurable manner.
With it, we can switch the Primary role to another Postgres node, or even replace it with an entirely new stack of servers at any time, and the only thing the client will experience is a short connection disruption. If the application is written using the full queue + cache approach described above, there may be no discernible client-side effect at all.
The reason we mention PgBouncer by name here is that it is one of the better examples at managing connection multiplexing. It emulates a model very similar to this:
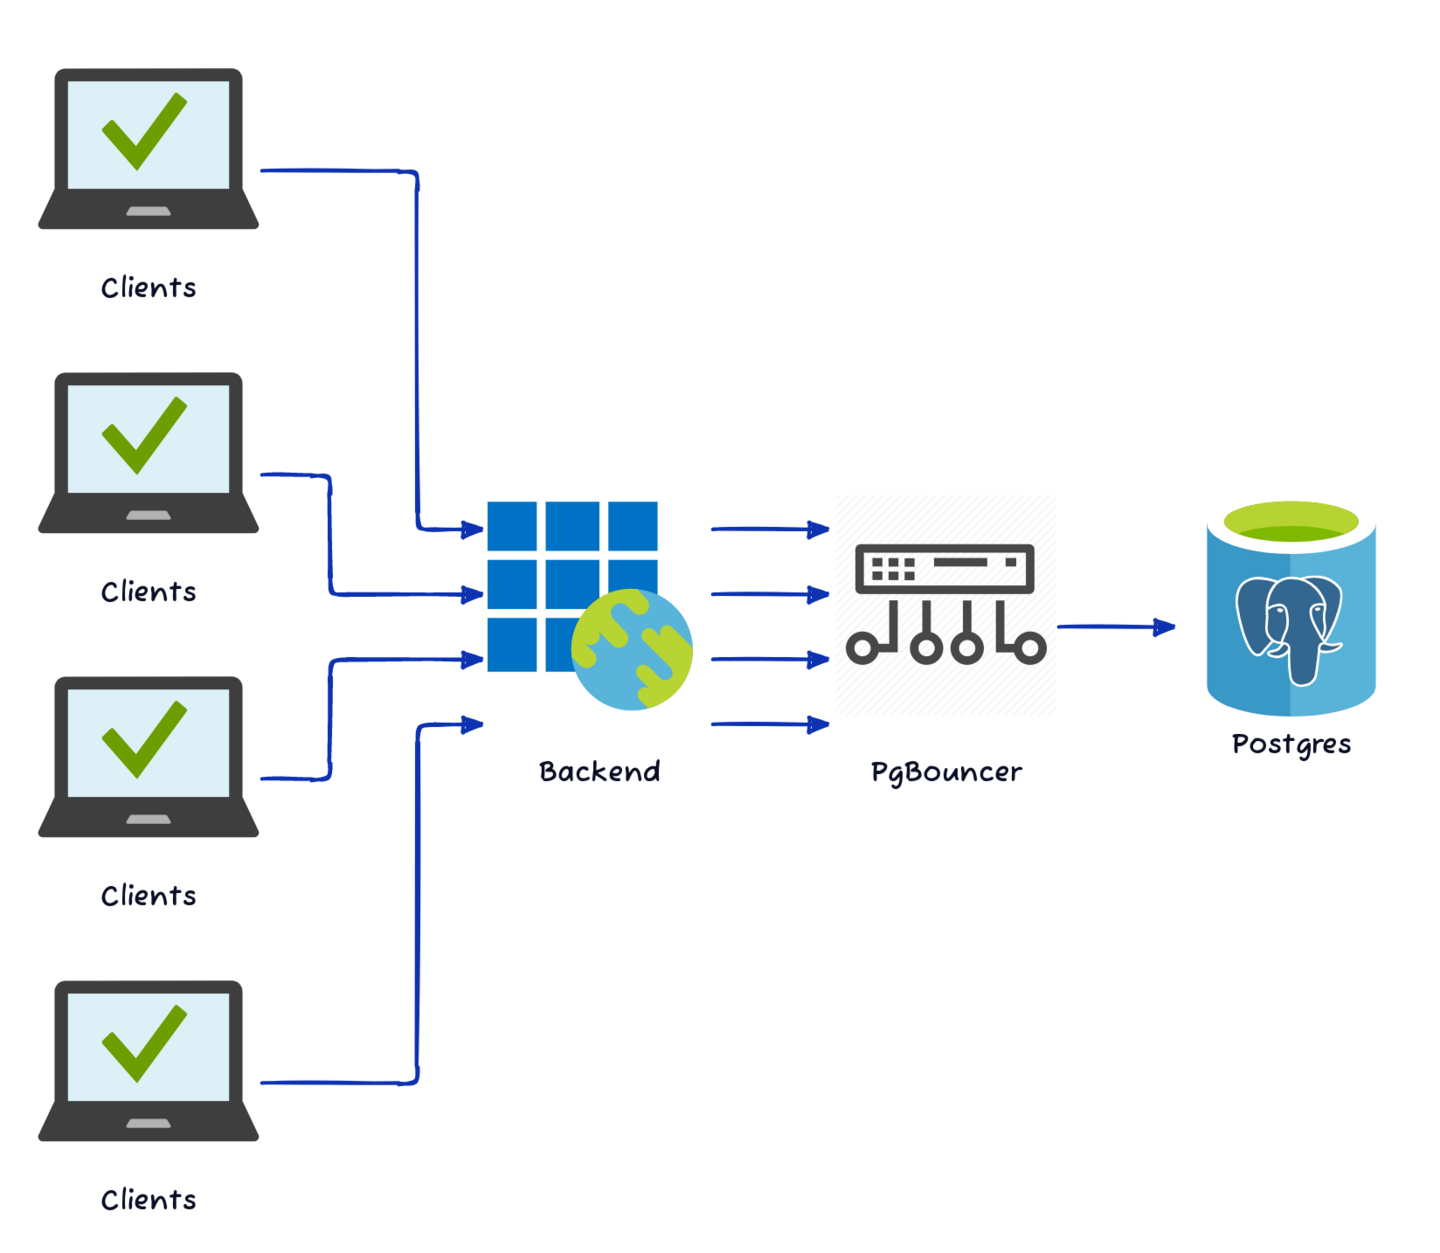
PgBouncer can manage connections from thousands of external client connections using only a few Postgres sessions. Depending on how active these connections are, the ratio can vary from 10-1 to 100-1 or even 1000-1. The end result is less connection overhead for Postgres to manage, and better overall performance.
Of course there are limitations here. PgBouncer (and proxies like it) work best in “transaction mode”, meaning that sessions are returned to the pool at the end of each transaction. This allows recycled sessions to service many client connections as long as they’re regularly submitting short and fast transactions. Applications that make heavy use of prepared statements, cursors, or any other object that is statically associated with a specific session, will all fail to operate normally under these circumstances.
That was the case with this financial platform as well. Not all is lost in these situations, either! Most Object Relational Mapping (ORMs) systems, database abstraction layers, and even some language drivers, often provide connection pooling capabilities. If these are used judiciously and connections are regularly returned to the pool once they’re no longer in use, the amount of direct connections to Postgres are still vastly reduced.
The primary drawback to this approach is that application servers tend to multiply. In the modern world of cloud computing, even a simple application may auto-scale to dozens or even hundreds of application servers due to client demand. Even if each of these aggregates 200 client connections to a single Postgres connection, that may still mean hundreds of direct connections to Postgres. Once again, this is one area where preemptive cache design can save us.
Traffic management
Clever use of Proxies also makes it possible to split read and write traffic such that we can leverage all of our Postgres servers to distribute high client connection demands. EDB’s own Dave Page covered this extensively in regard to Django. Django is hardly the only development framework that enables this kind of split read/write traffic as part of the design. Spring, an extremely popular Java framework for enterprise stacks, includes this functionality as well. And there are many more.
Patroni itself even provides a REST API specifically for routing based on the desired Postgres node target role. Combined with something like HAProxy or a REST-compatible load balancer, any application can redistribute read-only connections among all candidate Postgres nodes. If the Primary node is particularly write heavy, it can even be excluded from the pool of read targets.
This is also something we didn’t do on our financial platform. This meant we had an entirely idle Data Center, and the Standby itself was also completely idle unless the Primary failed. That’s a lot of wasted potential, especially considering the cost of the hardware involved. We justified it as an important investment to reduce our RPO and RTO, but it could have been leveraged for much more.
VACUUM tweaks
It’s fairly well known that Postgres tables require regular maintenance through the use of VACUUM. This is especially relevant to high throughput systems where the transaction counter may advance quickly enough to risk potential transaction ID wraparound in a short interval. Our system produced a billion transactions per day, threatening wraparound on almost a daily basis. With a higher client base and transaction volume, even a single day would eventually be too long to wait.
Some companies will disable autovacuum during heavy transaction volume periods of a few hours to prevent the associated storage IO, and may employ a script to manually vacuum all relevant tables at the end of the business day. The primary risk here is that the script could fail unnoticed until the next morning, and then the database may require downtime in the middle of the next day to address the issue. The easiest way to avoid this problem is to never risk it—never disable autovacuum for any reason. Instead, use the tuning knobs Postgres provides.
I’ve written an extremely thorough treatise on Tidying Up with VACUUM in a past article specifically to address this common issue. VACUUM is often misunderstood and misused. If it’s allowed to do its job, even the highest throughput OLTP system can indefinitely sustain multiple autovacuum workers to keep the wraparound horizon perpetually at bay. With little to no intervention once properly configured!
This isn’t optional; the default autovacuum settings could result in wraparound on a sufficiently high volume OLTP Postgres system. Our financial platform took the risk of disabling autovacuum during market trading hours, and luckily we never suffered an outage or wraparound as a result, but we easily could have. A better understanding of autovacuum and its underlying concepts is always a better approach.
Final thoughts
High throughput OLTP systems are incredibly sensitive to outages or perceived outages. Financial systems like the one described here are a fairly common pattern followed by other organizations. As technologies have evolved over the years, the ability to avoid or obfuscate the effects of a database outage have also improved. There are new frameworks, failover management tools, and tested combinations of them, that all contribute to a more stable and efficient Postgres cluster.
Whether you’re orchestrating a financial platform that handles a billion queries per day, or merely aspire to reach those heights, it pays to plan ahead. Sometimes, as in this case, the provided tools aren’t quite sufficient. The pg_prewarm extension can make up for many deficiencies caused by a database outage, but there’s still a minimum amount of IOPS to augment its capabilities. Maintenance such as autovacuum also relies on sharing IO with query activity, and in high volume scenarios, also may need better underlying IO. Proper queue and cache design can offset orders of magnitude of database requirements, allowing us to weaken the constraints of our High Availability stack.
Beneath it all, Postgres has been able to handle demanding Enterprise scenarios for decades now. OLTP systems have some special needs, but not many in the long run. Don’t let scale intimidate you from using the best RDBMS around!