Extending PostgreSQL Monitoring in Postgres Enterprise Manager by Creating Custom Probes

Allowing the user to define their own probe is one of the striking features of EDB Postgres Enterprise Manager (PEM). In this post, we will discuss how to create a custom probe using Postgres Enterprise Manager.
NOTE: This is an advanced feature, and we’re making an assumption that you’re aware of the architecture of EDB Postgres Enterprise Manager and understand how it works.
This post demonstrates how to create a custom probe, using a PEM 7.14 server installed on a Centos7 machine with PostgreSQL 12 as the backend database. EDB Postgres Advanced Server 12 is also installed and registered with PEM.
What is a probe?
Before we talk about how to create a custom probe, let's first talk about what a probe is. A probe is a scheduled task that returns a set of performance metrics about a specific monitored object. PEM uses probes to retrieve statistics from a monitored server, database, database objects (e.g., schema, table, index, view, etc.), operating system, or agent. There are almost 60 predefined system probes created by default.
If a performance metric is missing or needs improvement, then you can create, view, reconfigure, or delete your own custom probes. Creating a probe is a very tedious and complex task, however. Before moving ahead I would like you to take a breath, and decide first whether it is really necessary to create a new probe.
pemAgents are responsible for running these probes. They collect the metrics and store them in the PEM backend database server.
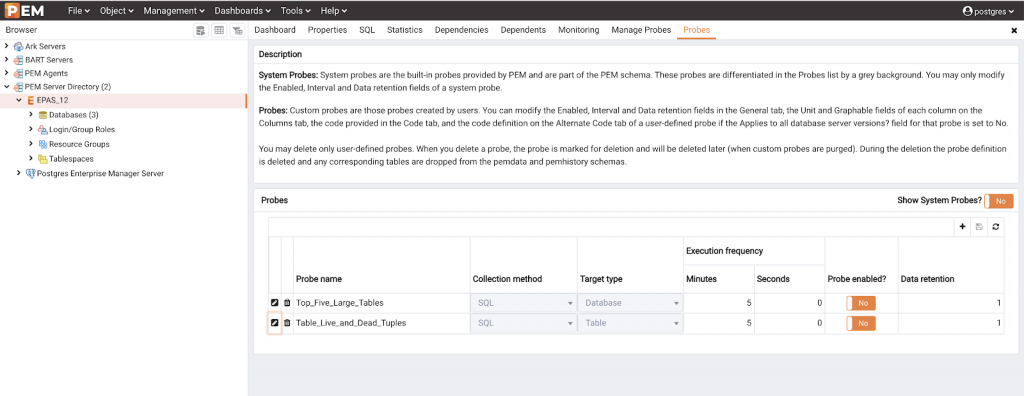
Accessing the probes
The Manage Probes page in PEM displays both system and custom probes. Select Manage Probes from the Management menu. The probe name, the probe execution frequency, the probe status (enabled or disabled), as well as the data retention interval are listed on this page as shown below:
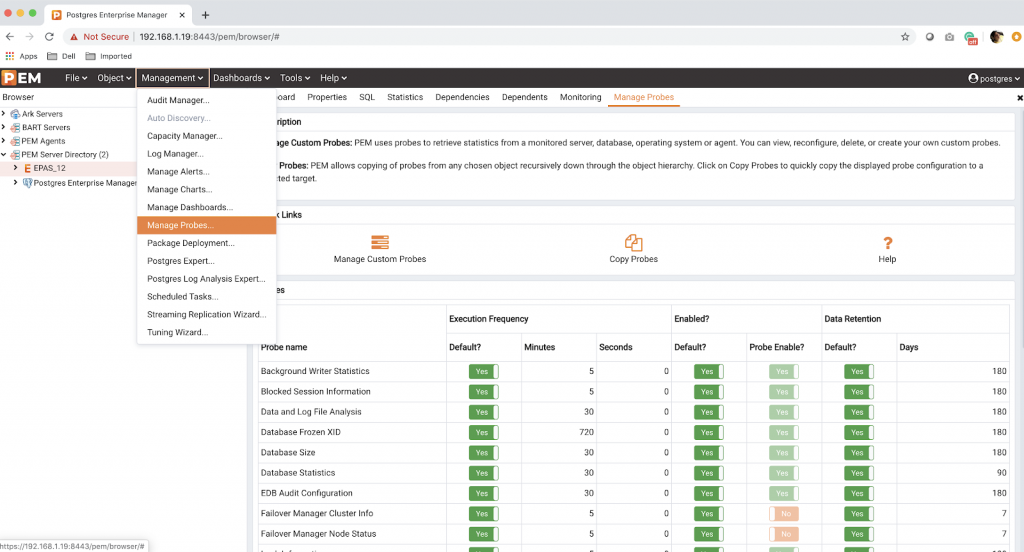
You can see the quick links on this page for Manage Custom Probes, Copy Probes and Help. Click on Manage Custom Probes to create, view, reconfigure or delete a custom probe.
Creating a custom probe
PEM uses three different methods for collecting metrics through a probe (defined as collection method):
1. SQL (the probe gathers information via a SQL SELECT statement)
- SQL probes are responsible for collecting metrics from a monitored server at different levels (e.g., server, database, schema, index, view, table, etc.).
2. WMI (the probe gathers information via a Windows Management Instrumentation extension)
- WMI probes always run only on Windows and use WMI scripts to collect only the operating system-level metrics (also referred to as an agent level probe).
3. Batch/Shell Script (the probe uses a command script or shell script to gather information)
- The batch script will run on Windows and allow users to collect metrics at the operating system level.
- The shell script will collect the metrics for the operating system.
- (NOTE: Scripts defined for these probes will run under a specific user, specified as ‘batch_script_user’ for each pemAgent in their respective configuration file.)
A custom probe can be created for different target types (at different levels):
- Server
- Database
- Schema
- Table
- Index
- Function
- View
- Sequence
- Agent/Operating System
Before starting to create a custom probe, you may want to define certain aspects of it. For example:
- For which object do you need to collect the metrics and create the probe?
- What is you collection method (SQL/WMI/BATCH/SHELL Script)?
- Do you want to retain the data for this probe? (NOTE: PEM allows you to define a custom line chart from historical data of a system/custom probe.)
- For how long would you like to retain the historical data?
- Do you want to enable this probe on all the monitoring objects by default?
(Recommendation—start with ‘Disabled’ by default, and enable them for particular monitoring objects from the Manage Probe tab)
- What metrics are to be collected, and their types?
Now let’s see how to create a custom probe step by step in the following examples:
Example 1: database-level probe
In this example you will learn how to create a custom probe at the database level with the SQL collection method.
Click on the Manage Custom Probes quick link on the Manage Probes page to create a custom probe. Select the ‘+’ sign in the upper-right corner of the tab to create a new custom probe.
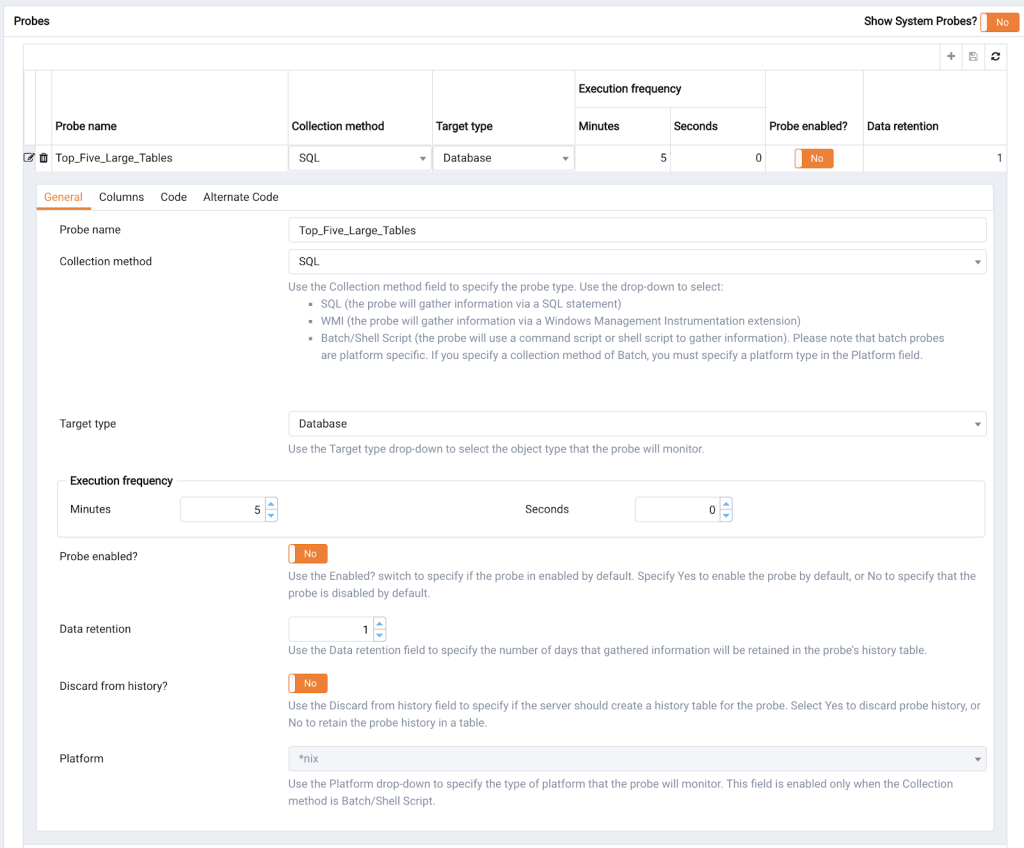
Step 1: General tab
Provide the following details on the General tab:
- Probe name - Top_Five_Large_tables (give any unique name)
- Collection method - SQL (as the probe will collect information via a SQL SELECT statement)
- Target type - Database (you can select server, table, index, function, view, etc.)
- Execution Frequency - 5 minutes 0 seconds (this is the interval at which the probe will run to collect information)
- Probe enabled? - No (you should create probes that are disabled by default, and enable probes for databases/objects as needed)
- Data retention - 1 day (probe will retain the information for the specified days in the corresponding probe’s history table)
- Discard from history? - No (select “no” to retain or “yes” to discard the probe history)
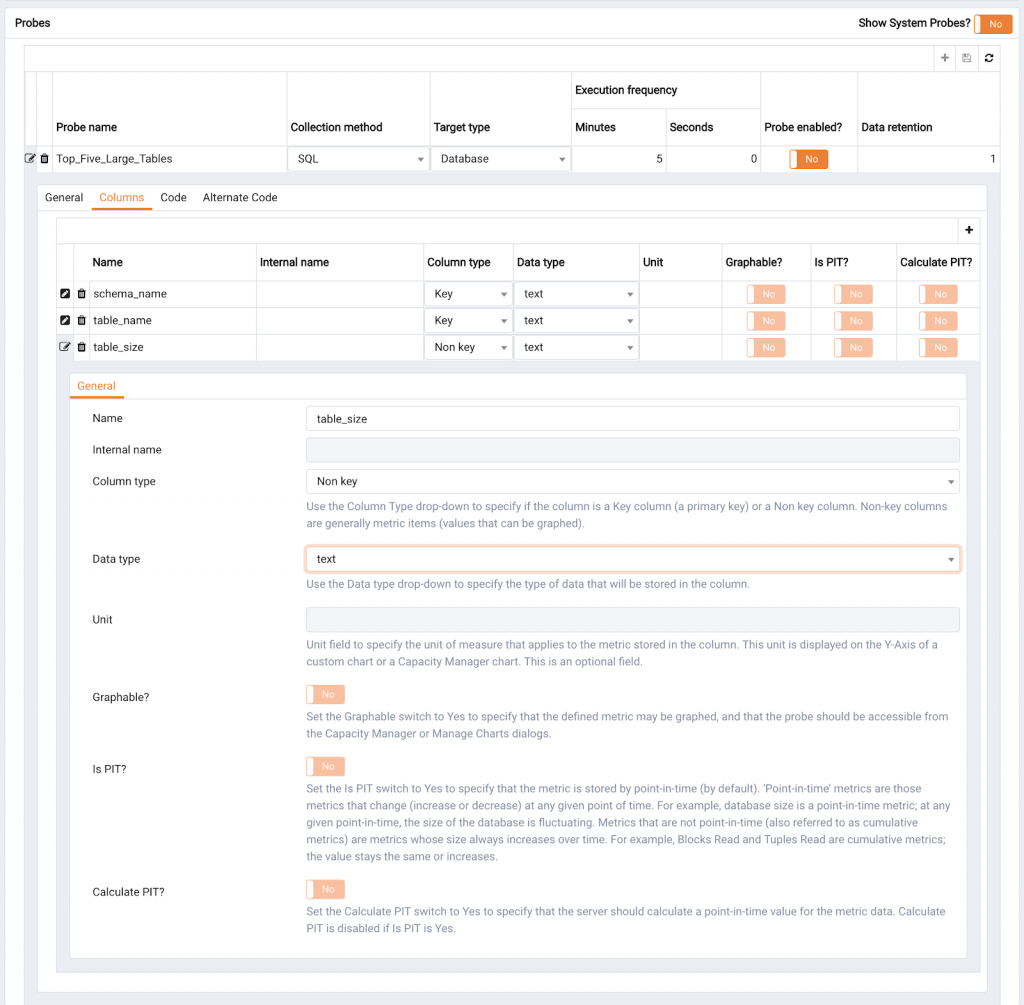
Step 2: Columns tab
Provide the following information on the Columns tab:
- Name - Add schema_name as the first column, table_name as the second column, and table_size as the third column (specify the name of each column to be added).
- Internal name - This field is disabled. It will take values automatically from the column names used in the code specified in the code tab.
- Column type - Key (i.e., primary key for the first column and the second column. The third column here we have added as non-key. We recommend at least one key per probe.)
- Data type - Text (select the data type from the drop-down list). The data type must match the data to be collected by the probe.
- Unit - Blank (specify the unit of measurement if needed.)
- Graphable - Disabled (as the data type is text).
- Is PIT? - Disabled (as the data type is text).
- Calculate PIT? - Disabled (as the data type is text).
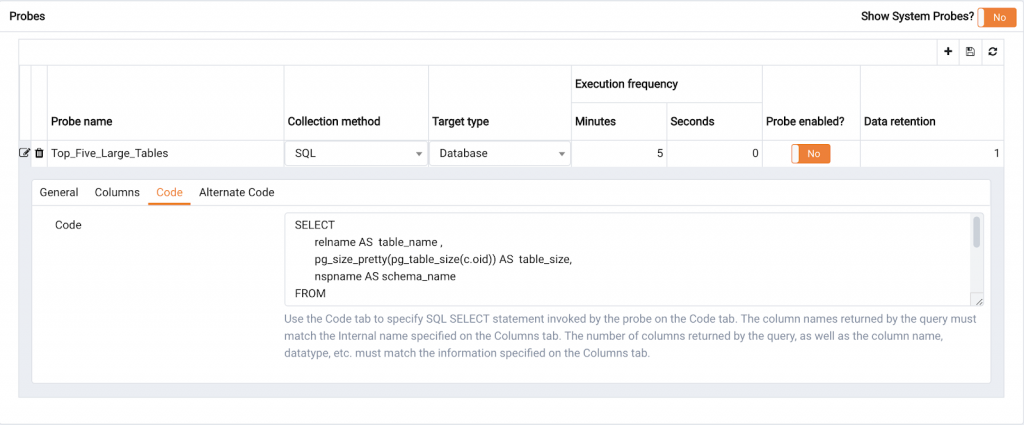
Step 3: Code tab
Provide the following SQL query in the code tab:
SELECT

       relname AS  table_name ,

       pg_size_pretty(pg_table_size(c.oid)) AS  table_size,

       nspname AS schema_name

FROM

       pg_class c

LEFT JOIN pg_namespace N ON (N.oid = c.relnamespace)

WHERE nspname NOT IN ('pg_catalog', 'information_schema') AND nspname !~ '^pg_toast' AND relkind IN ('r')

ORDER BY pg_table_size(c.oid)

DESC LIMIT 5;
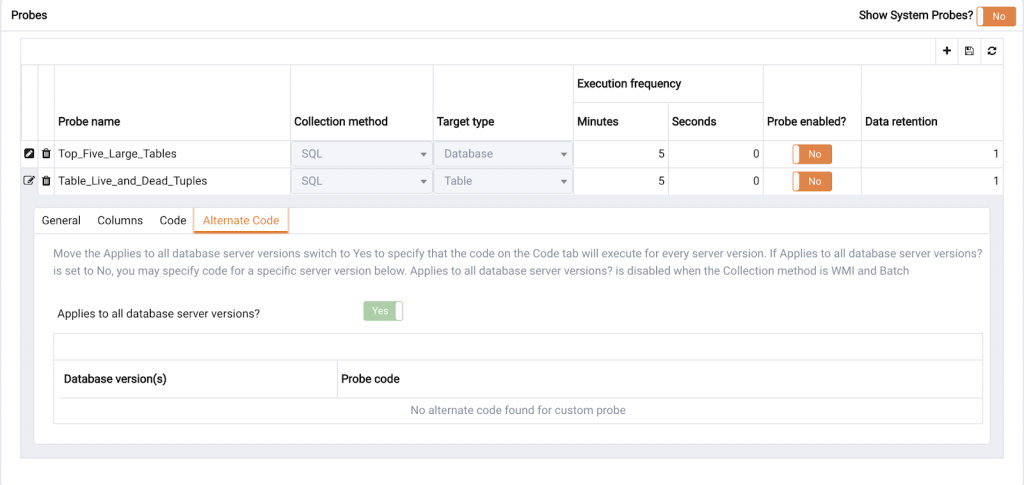
Step 4: Alternate code tab
Select Applies to all database versions? and switch to “yes”’
Select “+” on the upper right corner to add the alternate code for a particular version of the database server. In the screenshot below, for PostgreSQL 12 the following code is used:
SELECT

       relname AS  table_name ,

       pg_size_pretty(pg_relation_size(c.oid)) AS  table_size,

       nspname AS schema_name

FROM

       pg_class c

LEFT JOIN pg_namespace N ON (N.oid = c.relnamespace)

WHERE nspname NOT IN ('pg_catalog', 'information_schema') AND nspname !~ '^pg_toast' AND relkind IN ('r')

ORDER BY pg_table_size(c.oid)

DESC LIMIT 5;
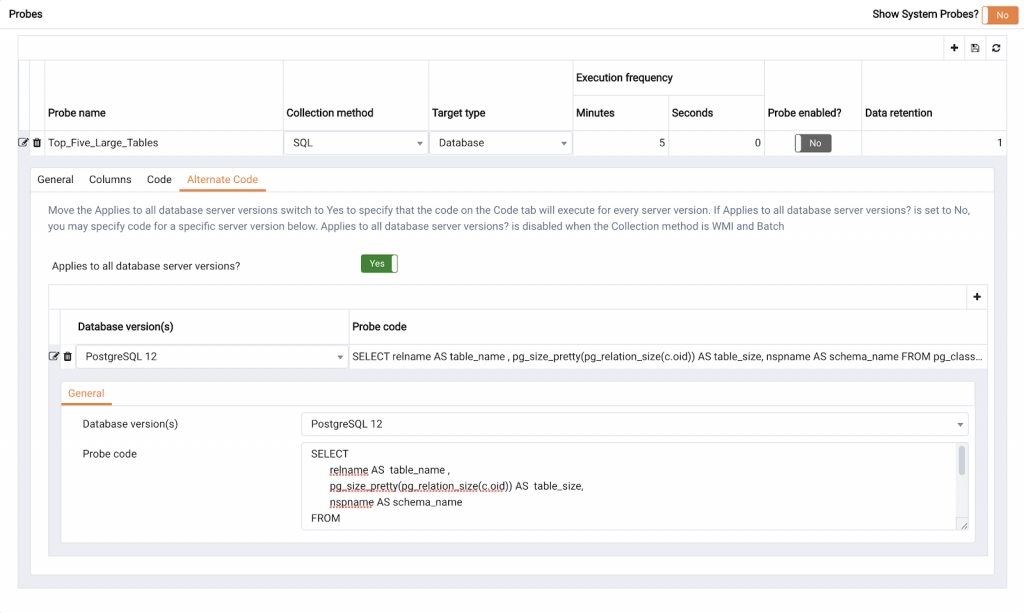
If the Applies to all database server versions? switch is set to “yes,” then a specified query in the Code tab will be used for all the database server versions. The query in the Alternate Code tab will run only on the selected database version.
If the switch is set to no, then the query in the Alternate Code tab will run only on the selected database version. If we write 'Empty String' in Alternate Code, then the query in the Code tab will run for all database server versions, and the query in the Alternate Code tab will be used for the specific selected database version.
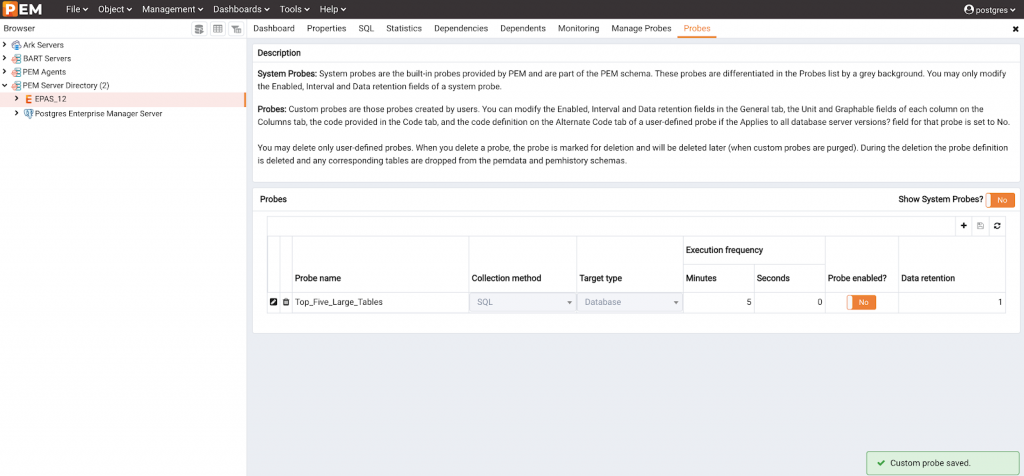
Step 5: Save the prob
Click on the Save button in the upper-right-hand corner to save the probe.
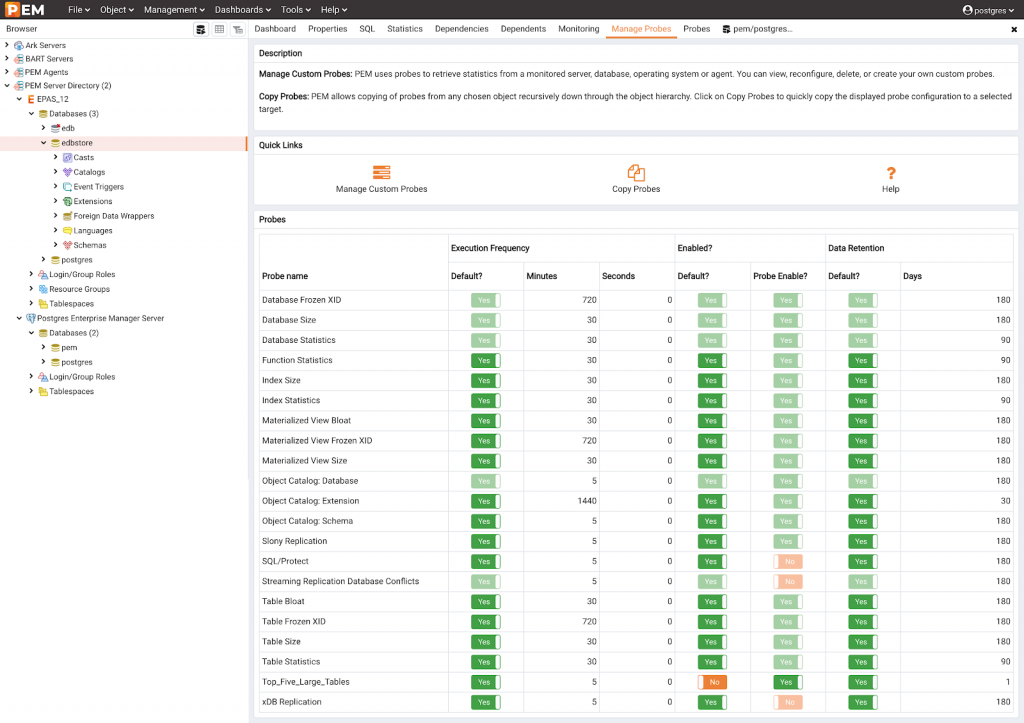
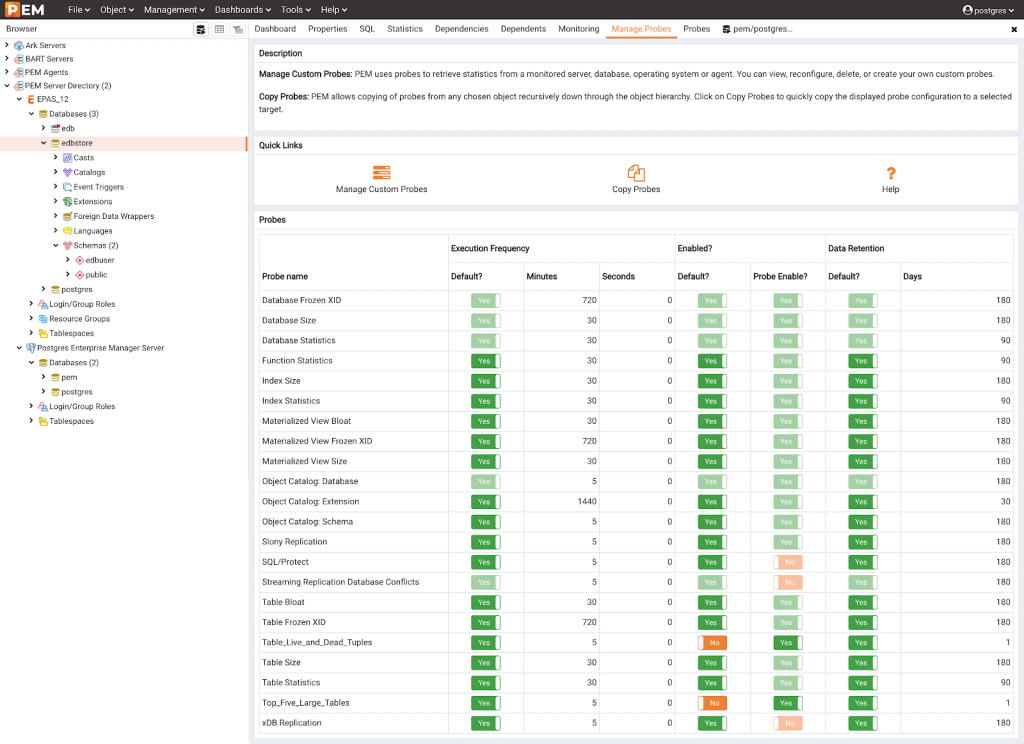
View and enable the custom probe
You can select any database (e.g., edbstore) in the Browser tree and then click on Manage Probes under the Management menu.
By default, the Default? switch under Enabled? is set to “yes.” Change the Default? switch to no and Probe Enable? switch to “yes” under Enabled? column for the edbstore database.
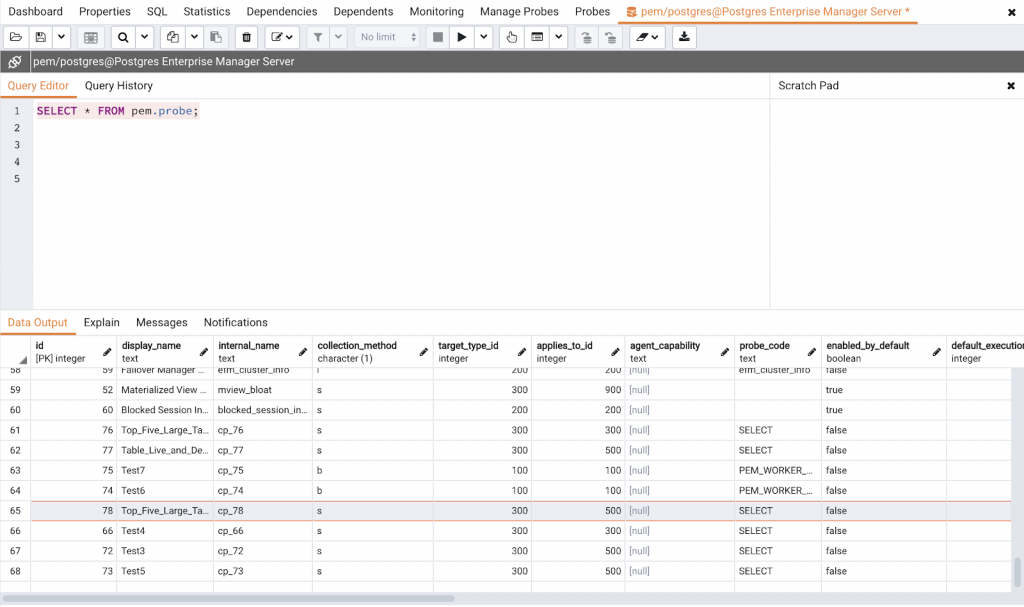
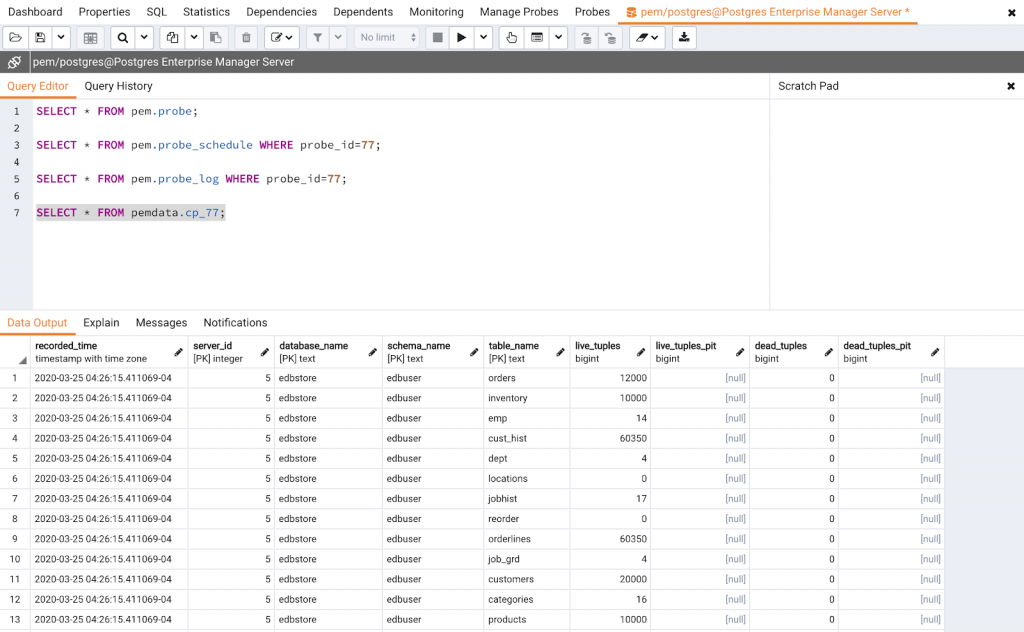
Query the probe tables to view the collected metrics
Once the probe is enabled for the edbstore database, it will run as per the selected intervals, collect the metrics, and populate the data in the probe tables. The probe tables are created in the PEM database on the PEM server host.
Whenever you create a custom probe, a corresponding table is created in the pemdata schema of the PEM database (repository of PEM server). The name of the table will take the form cp_xx, where “xx” is the (max_probe_id +1), for, e.g., cp_61, cp_62, and so on. These tables will hold the metrics that will be collected by the probe.
Also, there are several tables named probe_xxx in the PEM schema of the PEM database. These tables hold information about the probe, probe log, probe schedule, and so on.
As shown in the below screenshot, the probe id for Top_Five_Large_Tables is 78.
You can query the probe_schedule table in the PEM schema of the PEM database to find out the last execution time of the probe.
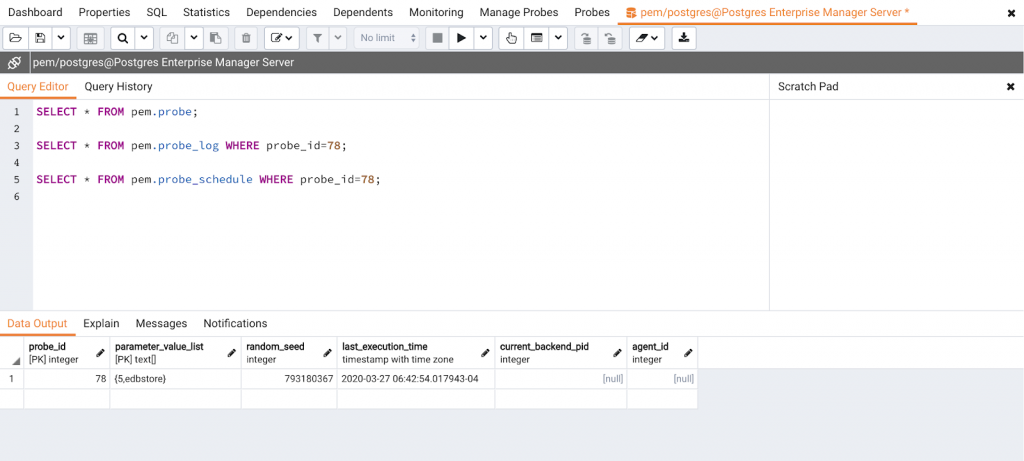
The metrics collected by the successful execution of the probe will be in the cp_78 table as shown below in the screenshot.

If the probe is not executed successfully, you can query the probe_log table to find out the error message. You can also check the error messages in /var/log/pem/worker.log file.
Example 2: table-level probe
In this example you will learn how to create a custom probe at table level with the SQL collection method.
Select the “+” button on the upper right-hand corner to create a custom probe.
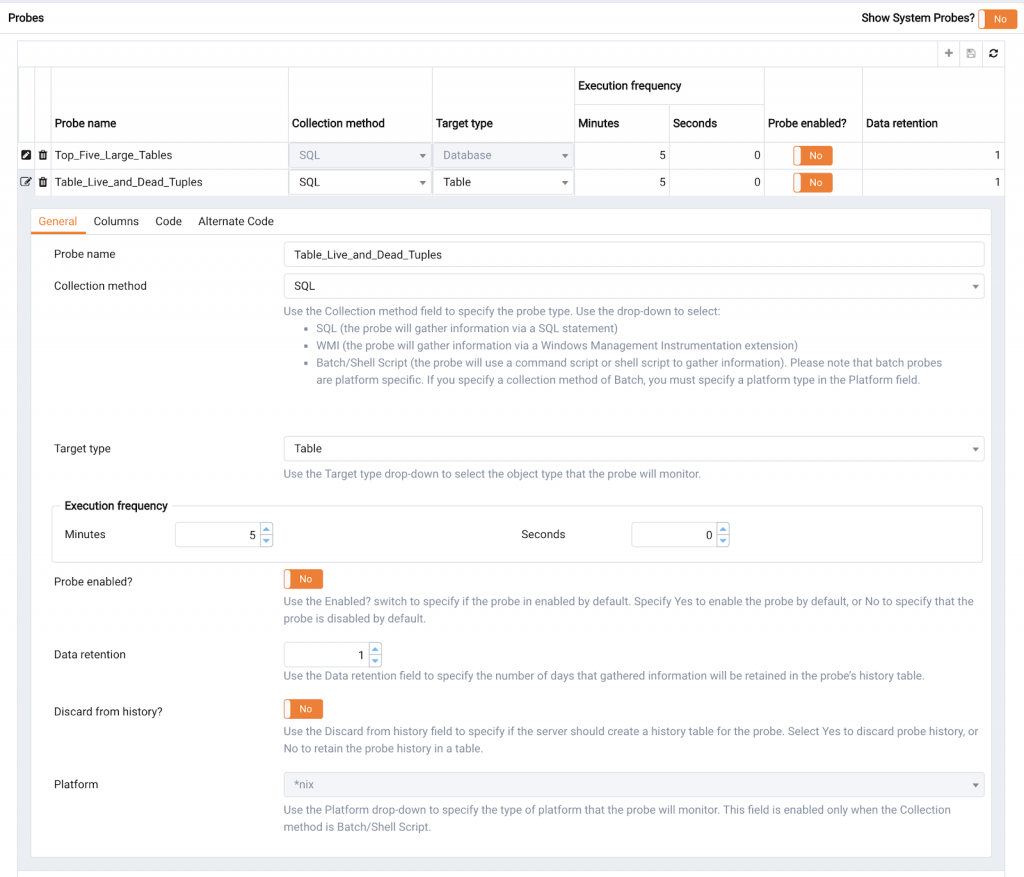
Step 1: General tab
Provide the Probe name, Collection method, Target type, Execution frequency, Probe enabled?, Data retention and Discard from history? fields as shown in the screenshot below:
Step 2: Columns tab
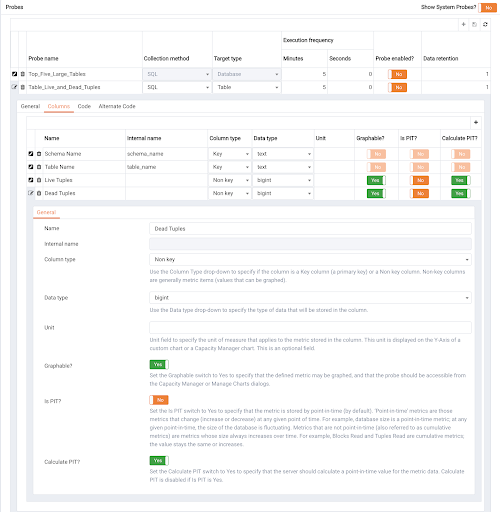
By default, a table-level probe will add two columns (Schema name and Table name) with a default column type and data type. To add more columns, provide the column name, column type, data type and other fields as required.
In our example, we’ll add the Live Tuples and Dead Tuples columns. The definition will take the internal names from the specified code on the code tab. The data type for both columns is bigint, and hence these metrics are graphable. You can select the following values for the remaining fields:
- Graphable - Yes (If the value is set to “yes” that means the metrics is graphable and can be available to the capacity manager and manage charts dialogue.)
- Is PIT? - No (You can also set the value to “yes” if the metrics are changing—i.e., increasing or decreasing numeric values.)
- Calculate PIT? - Yes (It will calculate the point-in-time value for the metric.)
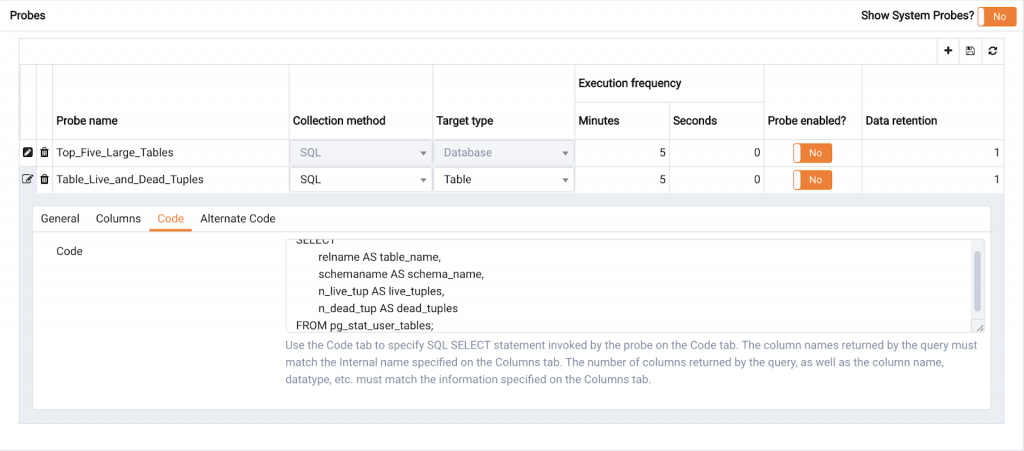
Step 3: Code tab
Provide the following code in the code tab:
SELECT

relname AS table_name,

            schemaname AS schema_name,

  n_live_tup AS live_tuples,

n_dead_tup AS dead_tuples

FROM pg_stat_user_tables;
Step 4: Alternate code tab
Set the Applies to all database server versions? switch to “yes.”
Step 5: Save the probe
View and enable the custom probe
To view or enable the custom probe, select any database (e.g., edbstore) in the Browser tree, and then click on Manage Probes under the Management menu.
By default thExtending PostgreSQL Monitoring in Postgres Enterprise Manager by Creating Custom Probes
Note: For a table-level probe you also need to select the database in the browser tree to enable the probe.
Query the probe tables to view the collected metrics
Once the probe is enabled for the edbstore database, it will run at the selected intervals, collect metrics, and populate the data in the probe tables.
Use the queries shown in the screenshot below to view the collected metrics:
I hope this post helps you better understand how to create a custom probe using PEM.