Benchmarking PostgreSQL on an AWS m5.metal instance

In this post, we share the benchmark testing results that we’ve performed across different PostgreSQL versions (v9.5.21 to v12.1) on an AWS m5.metal instance.
Hardware specifications
|
Name |
m5.metal (bare metal) |
|
Processor |
3.1 GHz Intel Xeon Platinum 8175 processors with new Intel Advanced Vector Extension (AVX-512) instruction set |
|
Storage |
Data is kept in a 300GB SSD with 2000 IOPS, and WAL is kept on another 150GB SSD with 2000 IOPS |
|
vCPU/RAM |
96/384GB |
Benchmarking specifications
The most popular tool for measuring the performance of PostgreSQL is pgbench. By default, pgbench runs a TPC-B-like script that includes simple UPDATE, SELECT, and INSERT statements. However, you can provide your own scripts for the test. In our case, we used the default scripts for the pgbench read-write test. The scale factor that we used for the test is 10,000, which generates approximately 150GB of data. We performed 30 minute read-write pgbench tests across different client counts (1, 16, 32, 64, 128, 256, and 512).
# Load the data

pgbench -i -s  10000 postgres


# Run the tests

pgbench -c $threads -j $threads -T  1800 -M prepared postgres
We configured the pgbench on the same server as our database server instance. Hence, we can assume that the effect of network latency is negligible. The CPU and memory consumption by the pgbench processes are also negligible.
Operating system configurations
It is imperative that we configure the OS parameters according to the database server and its workload. Poorly configured OS kernel parameters can cause degradation in database server performance.
Here are the operating system specifications that we used for the test:
|
Operating system |
CentOS 7 x86_64 |
|
data disk scheduler |
mq-deadline |
|
data disk readahead |
4MB |
|
transparent_hugepage |
enabled = false, defrag = false |
|
file system |
data=ext4, wal=ext4 |
|
vm.nr_hugepages |
52600 |
|
vm.swappiness |
1 |
|
net.core.somaxconn |
1024 |
|
vm.max_map_count |
3112960 |
Using huge pages reduces overhead when working with large contiguous chunks of memory, as PostgreSQL does, particularly when using large values for shared_buffers. Since we’re using a large shared buffer (100GB), we've set the huge pages parameter accordingly so that the entire shared buffer fits into that. It's calculated as follows:
grep VmPeak /proc/<postmaster pid>/status

VmPeak: 107574784 KB

Hugepagesize: 2048KB

Number of huge pages = 107574784/2048 = 52600 (approx.)
Since the database size (approx. 150GB) fits into RAM (396GB), we have minimized the swappiness. Setting net.core.somaxconn to a higher value (default is 128) is needed on a high load server where connection rates are high. This parameter controls the number of “not-yet-accepted” connections in the backlog buffers before failing. We also need to increase the max_map_count kernel parameter to avoid running out of map areas to accommodate large numbers of processes.
PostgreSQL configurations
We also need to tune the Postgres parameters to get a better performance. You can find the details of these parameters in the PostgreSQL documentation:
1. https://www.postgresql.org/docs/12/runtime-config-resource.html
2. https://www.postgresql.org/docs/12/runtime-config-connection.html
3. https://www.postgresql.org/docs/12/runtime-config-wal.html#RUNTIME-CONFIG-WAL-SETTINGS
|
shared_buffers |
100GB (25% of RAM) |
|
max_connections |
1000 |
|
min_wal_size |
20GB |
|
max_wal_size |
100GB |
|
checkpoint_timeout (secs) |
900 |
|
maintenance_work_mem |
1GB |
|
checkpoint_completion_target |
0.9 |
|
effective_io_concurrency |
200 |
|
synchronous_commit |
on |
|
log_checkpoints |
on |
|
wal_compression |
on |
We set the shared_buffers at 25% of the RAM. We also had to increase the max_wal_size in order to spread out the process of writing large quantities of new or changed data over a longer period of time. We ensured that at least one timed checkpoint happens after 15 minutes during the 30 minute test period. The checkpoint writes are spread out as much as possible, since we set the completion target to 0.9. Since we used SSD as storage, a higher value of effective_io_concurrency is recommended. This controls the number of IO requests that the storage can handle concurrently. Although we performed the test for various clients, we kept the max_connections as 1000. As long as those connections are not used, we can ignore the effects of setting max_connections to a higher value. However, it is recommended to use a connection pooler instead of using too many database connections.
Usually pgbench updates the tables uniformly. With high scale factor, there is a high chance that a single page from a large table (in this case, “pgbench_accounts”) will not be updated by many transactions. In other words, most of the transactions will cause full page writes, which will also increase the amount of write-ahead logging (WAL) written per second. In our case, the size of “pgbench_accounts” is 126GB, which is 16,515,072 blocks. If we have a 20,000 transactions per second (TPS), and each transaction is touching a new page from “pgbench_accounts,” it covers only 0.12% of “pgbench_accounts” per second but writes 157MB (= 20,000 * 8KB approx.) of WAL per second. We've measured the amount of WAL written in 1 minute: it is 8GB, which is really high. So, the checkpoint is occasionally getting triggered due to running out of WAL segments. Since the checkpoints are really long (due to high shared_buffers and probably 0.9 as completion target), the server accumulates a huge amount of WAL that is much larger than the max_wal_size set. In this case, the WAL disk runs out of space within 20 minutes. Besides, the frequent checkpoints affect the performance, significantly dropping the TPS with 64 clients to 12,000, compared to 26,000. Hence, we enabled the wal_compression, which improved the performance significantly.
It's difficult to perform the test without prewarming the tables. Because of the large dataset and the uniformity of pgbench update queries, it takes a very long time to bring a fair amount of data into the shared buffer. So, initially all the backends spend a significant amount of time reading pages from the disk and loading it to the shared buffer, and as a consequence, the TPS is really low and it takes a while to ramp up. Prewarming “pgbench_accounts” and “pgbench_accounts_pkey” takes approx 20 minutes. If we prewarm the tables, we get a stable TPS from the beginning.
Benchmarking results
As mentioned earlier, we performed the pgbench read-write tests across multiple clients for 30 minutes. We’ve taken median of three tests as the results. You can find the entire test setup here.
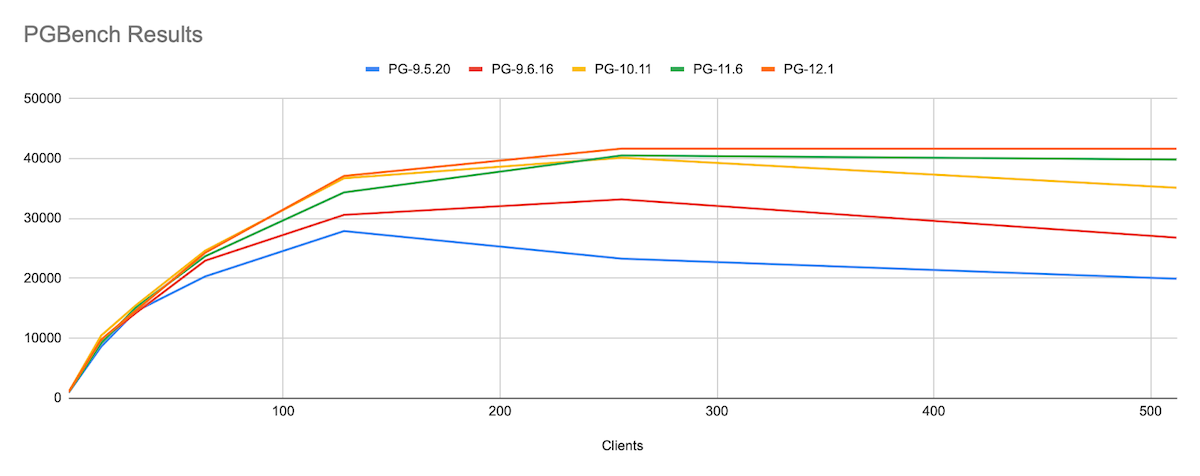
Observations
As the client count increases, we can see that scalability has been improved and the performance drop factor has been reduced significantly in recent versions of PostgreSQL. Although the number of clients exceeds the number of vCPU (which is 96), the performance didn’t drop for PG12.1. To verify this, we performed the same test in one of our high-end servers (Intel Xeon E7-8830 @ 2.13GHz, 127 CPUs with 500GB RAM), and it follows the same pattern. We’ve tried to identify a few important features in each version that might have improved the performance.
|
Major Versions |
Features |
|
v9.6.* |
Reduce contention for the ProcArrayLock (Amit Kapila, Robert Haas) |
|
Improve performance by moving buffer content locks into the buffer descriptors (Andres Freund, Simon Riggs) |
|
|
Replace shared-buffer header spinlocks with atomic operations to improve scalability (Alexander Korotkov, Andres Freund) |
|
|
Use atomic operations, rather than a spinlock, to protect an LWLock's wait queue (Andres Freund) |
|
|
Increase the number of clog buffers for better scalability (Amit Kapila, Andres Freund) |
|
|
Where feasible, trigger kernel writeback after a configurable number of writes, to prevent accumulation of dirty data in kernel disk buffers (Fabien Coelho, Andres Freund) |
|
|
Perform checkpoint writes in sorted order (Fabien Coelho, Andres Freund) |
|
|
v10.* |
Pad arrays of unnamed POSIX semaphores to reduce cache line sharing (Thomas Munro)
This reduces contention on many-CPU systems, fixing a performance regression (compared to previous releases) on Linux and FreeBSD. |
|
v11.* |
Use group updates when setting transaction status in clog (Amit Kapila) |
|
v12.* |
Use pread() and pwrite() for random I/O (Oskari Saarenmaa, Thomas Munro)
This reduces the number of system calls required for I/O |
However, this is not a complete list. There are numerous minor improvements that contributed towards this consistent performance improvement. While performing the tests, we observed that the throughput in SSD was hitting its IO limit, which is 2000 IOPS. Hence, we believe increasing that should improve the performance further. In the future, we would like to explore this. We will also investigate the root-cause of the performance improvement in each version using some performance analysis tools like perf.