Dashboards in pgAdmin 4

Overview
The dashboard tab in pgAdmin shows an analysis of the activity statistics for the selected server or database.
It also shows quick links to Add New Server, Configure pgAdmin, and Documentation if a Server Group node is selected from the browser tree.
The dashboard tab has 2 sections when a Server or Database is selected:
- Graphs:
pgAdmin has 5 different graphs to show the statistics for the server or database:
a. Server sessions or Database sessions
b. Transactions per seconds
c. Tuples in
d. Tuples out
e. Block I/O
2. Server Activity:
It shows the server or database information in 4 different tabs.
a. Sessions
b. Locks
c. Prepared Transactions
d. Configuration (only shown for Servers)
Graphs
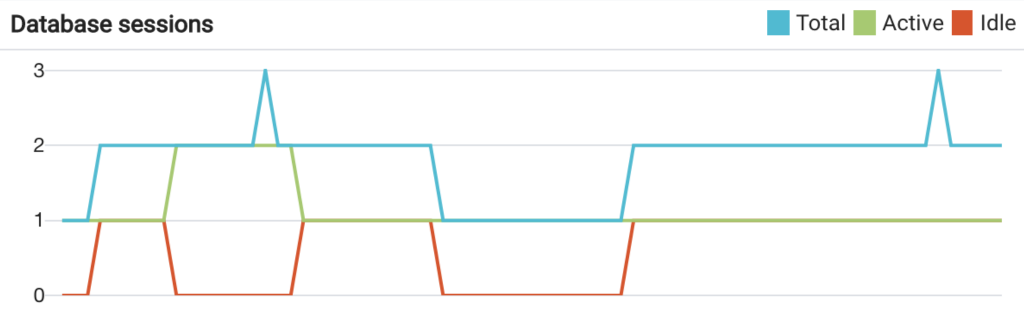
1. Server sessions or Database sessions:
The Server sessions or Database sessions graph displays the connections to the server or database. It shows the total, active, and idle sessions for the server or database:
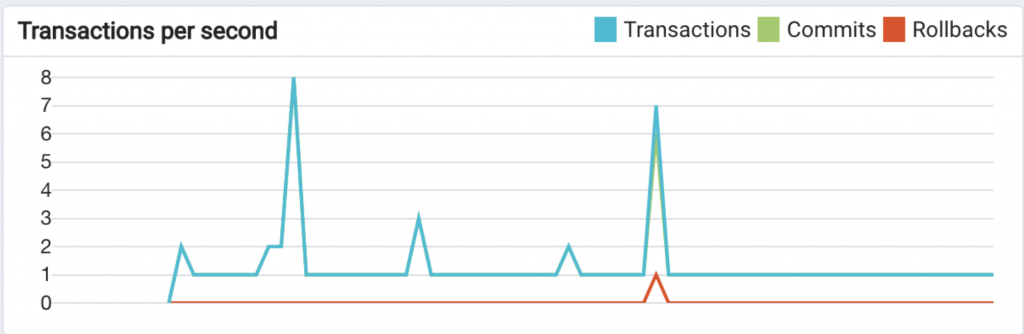
2. Transactions per seconds
The Transactions per second graph shows the commits, rollbacks, and total transactions per second that are taking place on the server or database:
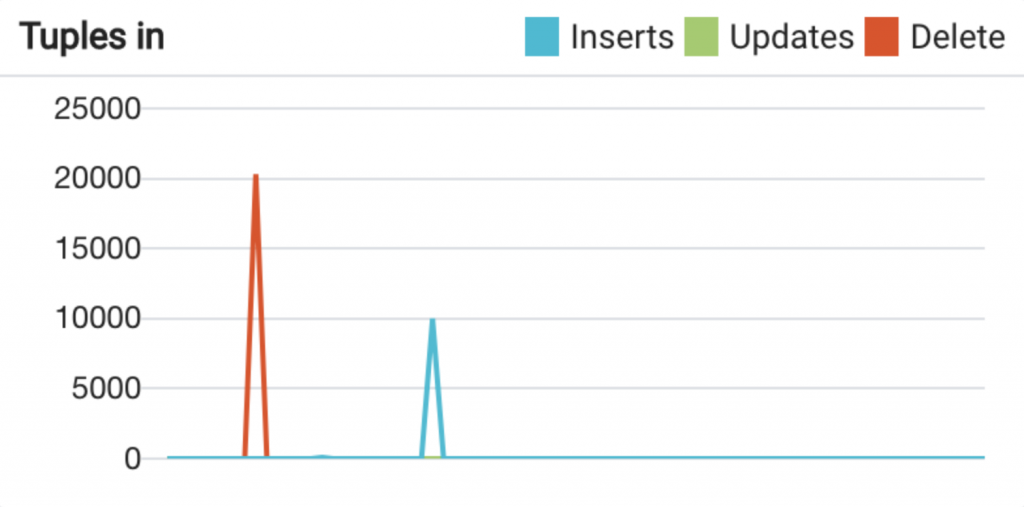
3. Tuples in
The Tuples in graph displays the number of tuples inserted, updated, and deleted on the server or database:
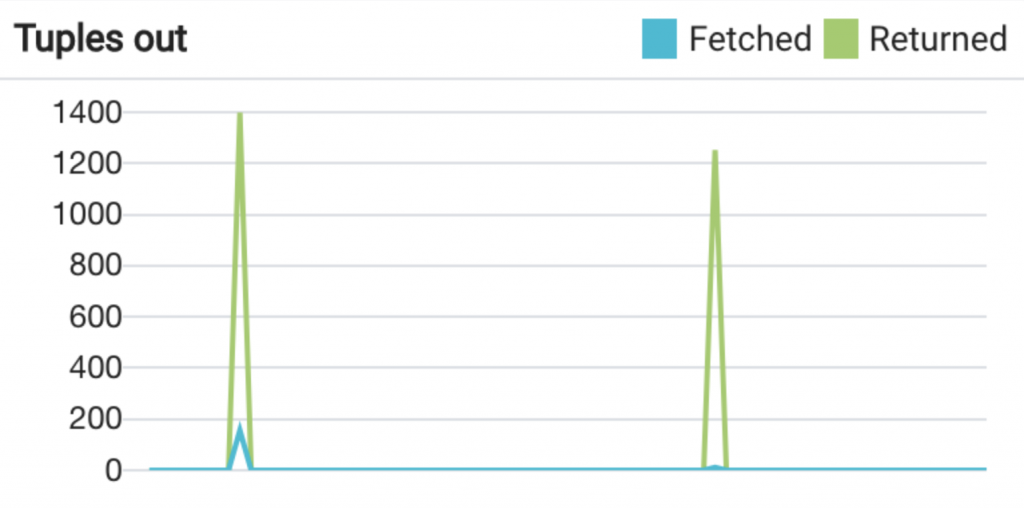
4. Tuples out
The Tuples out graph displays the number of tuples fetched and returned from the server or database.
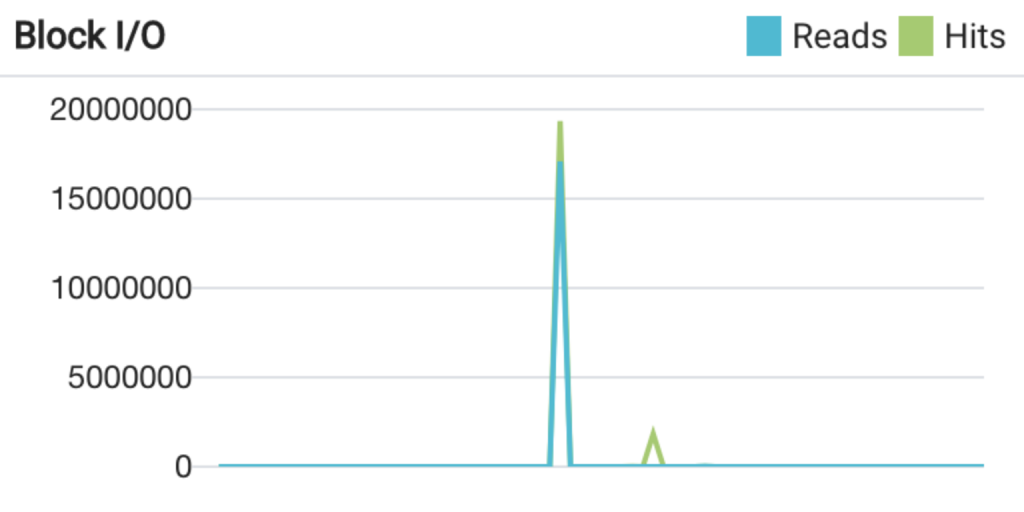
5. Block I/O
The Block I/O graph displays the number of blocks read from the filesystem or fetched from the buffer cache (but not the operating system’s file system cache) for the server or database:
Server activity
The Server activity panel displays information about sessions, locks, prepared transactions, and server configuration (if a server is selected in the browser tree). Use the Refresh button to update the information in the table, and use the Search box to filter the results.
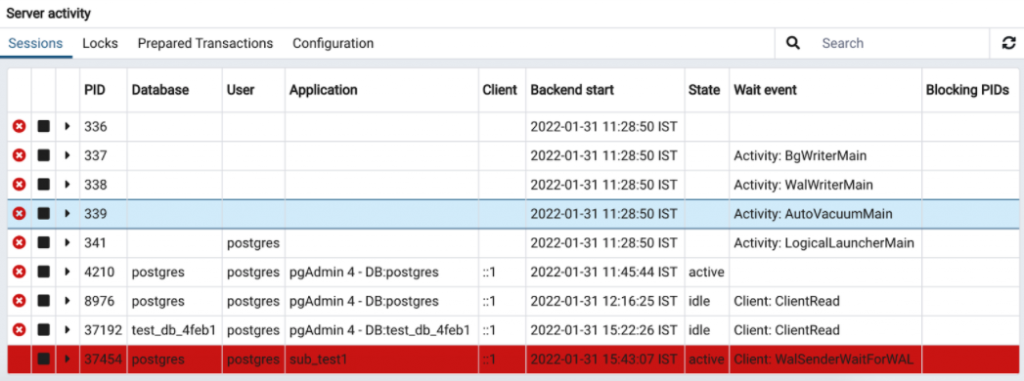
- Sessions
It shows all the active sessions for the selected Server or Database. Users can set the warning and alert threshold value to highlight the long-running queries on the dashboard from Preferences (This will be explained further in the Configure pgAdmin section below):
a) Use the Terminate icon (located in the first column) to stop a session and remove the session from the table. Before the server terminates the session, you will be prompted to confirm the operation.
b) Use the Cancel icon (located in the second column) to terminate an active query without closing the session. Before canceling the query, the server will prompt you to confirm the operation. When you cancel a query, the value displayed in the State column of the table will be updated from Active to Idle. The session will remain on the table until the session is terminated.
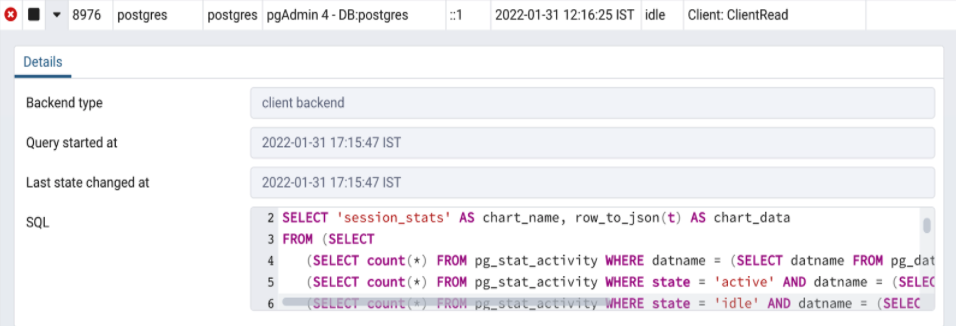
c) Use the Details icon (located in the third column) to open the Details panel which displays further information about the selected session.
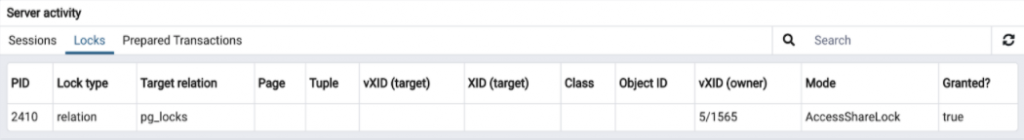
2. Locks
This panel shows all the locks acquired on the server or database:
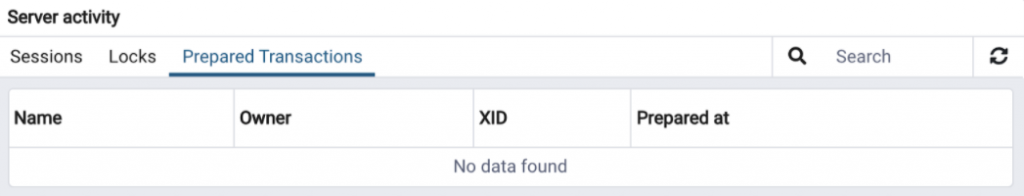
3. Prepared Transactions
This panel shows all the prepared transactions in the selected server or database.
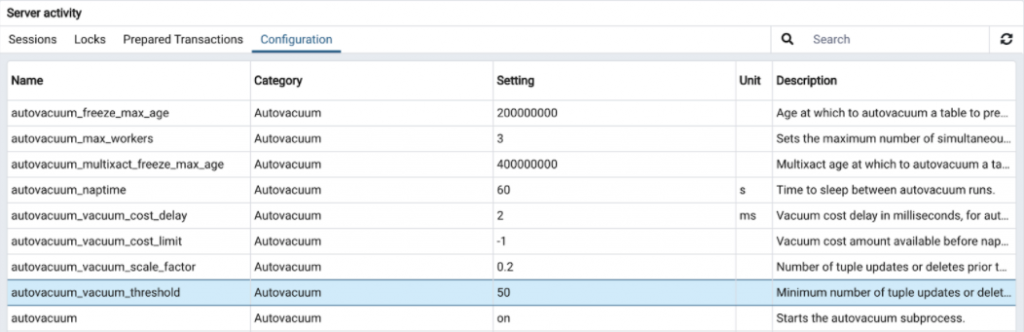
4. Configuration
It shows the server configuration if a server is selected in the browser tree:
Configure pgAdmin
Use preferences to configure the dashboard; go to the File menu from menubar, select Preferences, and navigate to the Dashboards option in the tree. It has 2 options.
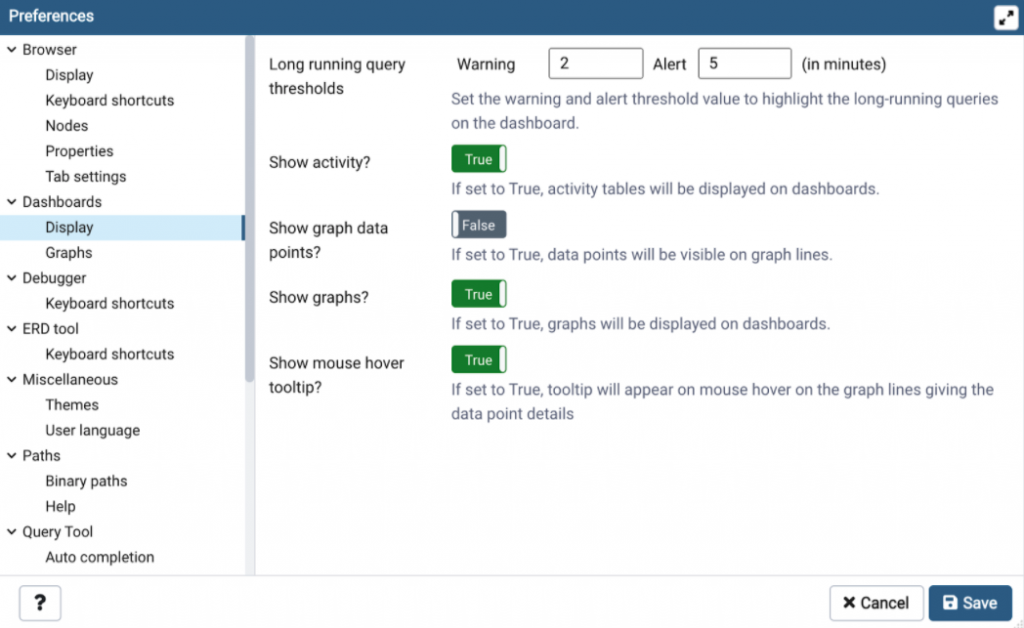
- Display
This section has 5 different settings, which can be used to configure the dashboard tab as per requirements.
a. Long running query thresholds: Set the warning and alert threshold value to highlight the
long-running queries on the dashboard.
b. Show activity? : If it is set to True, the Server activity tab will display on the dashboard.
c. Show graph data points? : If it is set to True, the data points will be visible on graph lines.
d. Show mouse hover tooltip? : If set to True, the tooltip will appear on mouse hover on the graph lines to
display data point information.
2. Graphs
Set the time in seconds to refresh the graph data on the UI.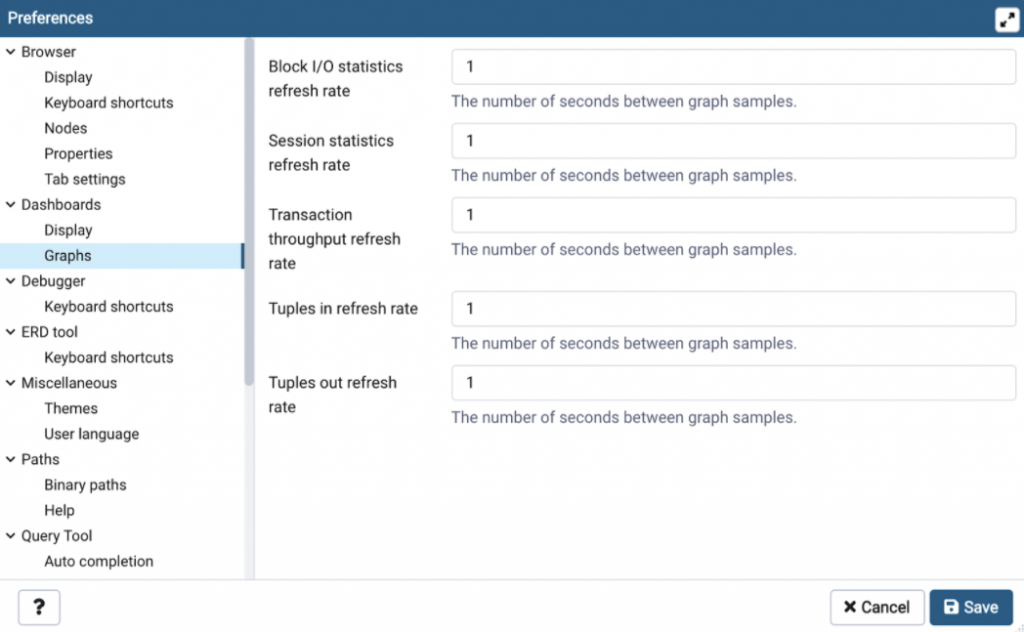
Conclusion
The Dashboards in pgAdmin provide information that is useful to monitor the server or database on an ad-hoc basis. Users can set different settings to customize the dashboard as their requirements.