
 The EDB Postgres™ Enterprise Manager is an enterprise management tool designed to tune, manage, and monitor a large number of Postgres deployments on servers on-premises or spread out across geographical boundaries. It is the cornerstone of the Management Suite of tools that is integrated into the EDB Postgres™ Platform from EnterpriseDB® (EDB™) and it emerged to solve a great many challenges database administrators faced daily. (The blog, How to Be the Master of Your Database Domain, explored EDB Postgres Enterprise Manager in greater detail.)
EDB customers use EDB Postgres Enterprise Manager for the following key features:
- Management of multiple EDB Postgres Advanced Server deployments
- Capacity planning
- Performance monitoring
- Alert Management
- Auditing violation
- Database Analysis
- Postgres Expert
Recently one of EDB’s customers acquired a company that was hosting its data on Amazon PostgreSQL RDS. The customer wanted to leverage EDB Postgres Enterprise Manager to monitor the database deployments on PostgreSQL RDS.
At the time, this request was considered a real possibility. A significant amount of development expertise has gone into EDB Postgres Enterprise Manager to create a sophisticated, enterprise-class tool for managing vast deployments of Postgres. As for remote monitoring, EDB Postgres Enterprise Manager had the capacity to monitor remote databases using an agent on a designated server. EDB Postgres Enterprise Manager also provides capabilities for users, such as database administrators, to create their own custom probes, custom dashboards, and custom alerts. Combined, all of these capabilities mean EDB Postgres Enterprise Manager ultimately provides the kinds of control and flexibility DBAs needed for managing databases that are hosted in different environments.
EDB worked closely with the customer to develop a process for utilizing their subscription for the EDB Postgres Enterprise Manager, which is part of the EDB Postgres Platform, with PostgreSQL databases on Amazon RDS. The steps were formalized into a repeatable process so others could follow suit and enjoy the benefits of EDB Postgres Enterprise Manager in their cloud deployments.
The following are the steps for using EDB Postgres Enterprise Manager with Amazon PostgreSQL RDS:
Amazon PostgreSQL RDS comes with an rds_superuser, which is not the same as a super user in PostgreSQL. Rds_super role has a lot of limitations, and they effect the monitoring capabilities.
To use EDB Postgres Enterprise Manager with PostgreSQL RDS, follow these steps:
1. Use the following function to modify the EDB Postgres Enterprise Manager probes so that it can leverage user defined views on some catalog tables:
CREATE OR REPLACE FUNCTION strip_pg_catalog_from_probe() RETURNS
boolean LANGUAGE plpgsql AS $function$  DECLARE    rec RECORD;  BEGIN
CREATE TABLE pem.probe_code_backup AS SELECT id, probe_code FROM
pem.probe WHERE id IN (1, 2, 3, 9, 10, 12, 13, 14, 15, 16, 17, 18, 19,
20, 21, 23, 24, 25, 29, 36, 39, 47, 52, 53, 54);    FOR rec IN SELECT
id, probe_code FROM pem.probe WHERE id IN (1, 2, 3, 9, 10, 12, 13, 14,
15, 16, 17, 18, 19, 20, 21, 23, 24, 25, 29, 36, 39, 47, 52, 53, 54)
LOOP       UPDATE pem.probe SET
robe_code=replace(rec.probe_code,'pg_catalog.','') where id=rec.id;
END LOOP;    RETURN true; END; $function$;
2. After creating the above function, execute the above function in the EDB Postgres Enterprise Manager server database as shown below:
psql -h localhost –c “SELECT strip_pg_catalog_from_probe()” pem
3. Connect to PostgreSQL RDS database as rds_super user and execute the following SQL in Postgres and the user’s defined database:
CREATE USER monitor PASSWORD 'password'; GRANT rds_superuser TO
monitor; CREATE SCHEMA rds_pem_views; SET search_path TO rds_pem_views;
CREATE OR REPLACE VIEW pg_database AS SELECT oid,* FROM
pg_catalog.pg_database WHERE datname <> 'rdsadmin';  CREATE OR REPLACE
VIEW pg_tablespace AS SELECT oid, * FROM pg_tablespace WHERE spcname <>
'pg_global';  CREATE FUNCTION rds_pem_views.pg_ls_dir(text) RETURNS
TEXT LANGUAGE sql AS $function$    SELECT ''::TEXT; $function$;  GRANT
ALL ON FUNCTION rds_pem_views.pg_ls_dir(text) TO monitor; GRANT ALL
ON SCHEMA rds_pem_views TO monitor; GRANT ALL
ON  rds_pem_views.pg_database TO monitor; GRANT ALL
ON  rds_pem_views.pg_tablespace TO monitor;  ALTER USER monitor SET
search_path TO rds_pem_views,pg_catalog, "$user", public;
The above SQL will create a database user “monitor” with “rds_superuser” privileges.
As mentioned above, rds_superuser in RDS is not the same as a true superuser in PostgreSQL, therefore a schema with a view for pg_database and for pg_tablespace is created.
Views pg_database and pg_tablespace are created because the rds_superuser role has the following restrictions:
- Rds_superuser or normal user in PostgreSQL RDS cannot access rdsadmin database;
- Rds_superuser or normal user in PostgreSQL RDS cannot calculate the size of pg_global tablespace;
- Rds_superuser cannot use pg_ls_dir to list the WAL files in pg_xlog directory.
- After executing SQLs, mentioned in step three, we can now use the database user monitor for EDB Postgres Enterprise Manager monitoring.
- For remote monitoring of PostgreSQL RDS, use the following link to add the following server:
https://www.enterprisedb.com/docs/en/6.0.2/pemgetstarted/getting_started_guide.1.14.html#
When you are following the documentation, please remember to click on “remote monitoring” and choose the EDB Postgres Enterprise Manager agent (PEM Agent) for remote monitoring as shown below:
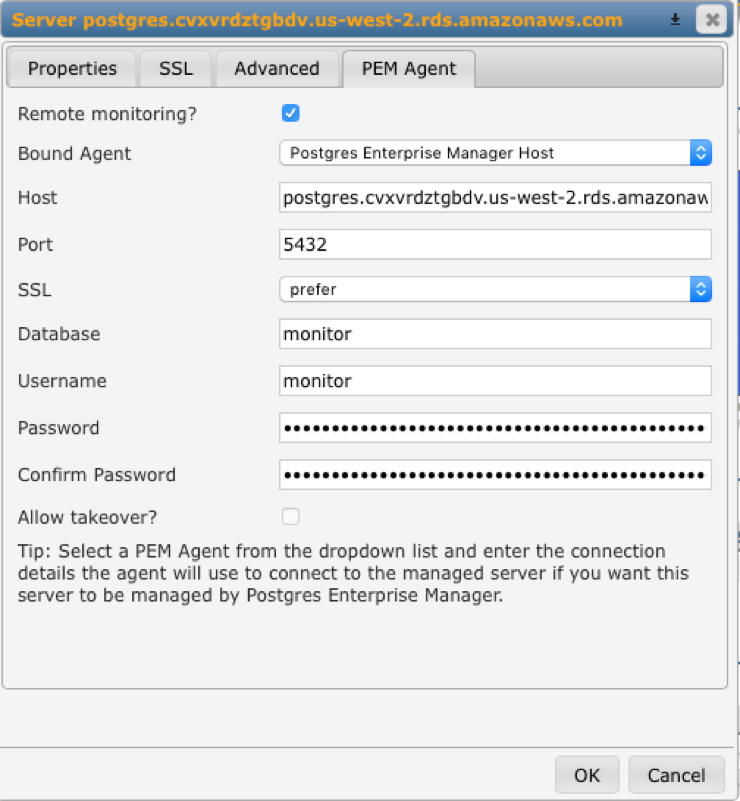
In the above, Bound Agent is pemagent running on PEM Server. Also note that the database is monitor.
After performing the above steps, the EDB Postgres Enterprise Manager server can monitor PostgreSQL RDS, and it can collect all database level statistics. Also, DBAs and other users can configure all database level alerts like autovacuum, etc. EDB Postgres Enterprise Manager provides 63 templates for database level alerts. It also provides flexibility for DBAs and other users to create their own alerts based on custom probes.
Now, some users might have questions or concerns about about system level information from Amazon PostgreSQL RDS, and whether EDB Postgres Enterprise Manager can monitor that data. The answer is yes.
As an example, the following are the steps for configuring EDB Postgres Enterprise Manager to monitor the CPU utilization of PostgreSQL RDS:
1. Install the Amazon Cloudwatch tools on the EDB Postgres Enterprise Manager Server using following command:
wget http://ec2-downloads.s3.amazonaws.com/CloudWatch-2010-08-01.zip
unzip CloudWatch-2010-08-01.zip
For more information on setting the Amazon CloudWatch command line, please use the following link:
http://docs.aws.amazon.com/AmazonCloudWatch/latest/cli/SetupCLI.html
2. Create an IAM user on the AWS panel, and attach the managed policy “CloudWatchReadOnlyAccess”.
For more information, please refer to the following link:
3. Create an AWS Credential File using the following sample:
AWSAccessKeyId= AWSSecretKey=
For more information on AWS Credential file, please use the following link:
http://docs.aws.amazon.com/cli/latest/userguide/cli-chap-getting-started.html
4. Change the permission of the above Credential file using the following command:
chmod 600 credential_file
5. Create a following script to get the CPUUtiliztion information from Amazon CloudWatch:
#!/bin/bash export
AWS_CREDENTIAL_FILE=/usr/local/aws/credential/credential-file-path
export AWS_CLOUDWATCH_HOME=/root/CloudWatch-1.0.20.0 export
PATH=$PATH:$AWS_CLOUDWATCH_HOME/bin export JAVA_HOME=/usr/lib/jvm/jre
export AWS_CLOUDWATCH_URL=http://monitoring.us-west-2.amazonaws.com
echo -e "avg_cpu\tminimum_cpu\tmax_cpu" mon-get-stats CPUUtilization --
namespace="AWS/RDS" --dimensions="DBInstanceIdentifier=postgres" --
statistics Average,Minimum,Maximum|tail -n 1|awk '{print $3"\t"$4"\t"$5}'
6. After creating the above script, make the script executable as given below:
chmod +x rds_cpu.sh
Now you are ready to create a custom probe to use this script for monitoring with EDB Postgres Enterprise Manager.
To create a custom probe, please visit the following link:
Below is a snapshot of a custom probe which I have used:
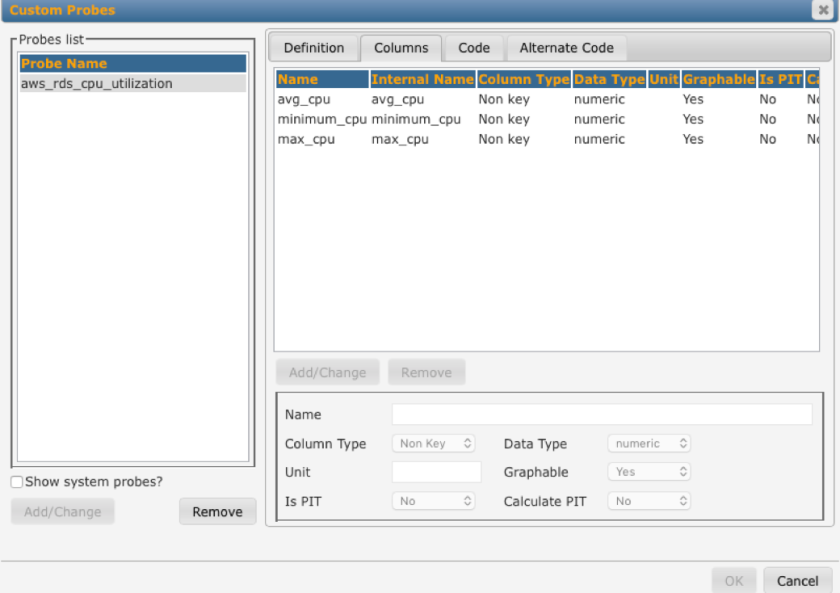
By using above probes, user can create their custom alerts in EDB Postgres Enterprise Manager for monitoring CPU utilization on Amazon PostgreSQL RDS. Also they can use data for creating a custom dashboard for RDS.
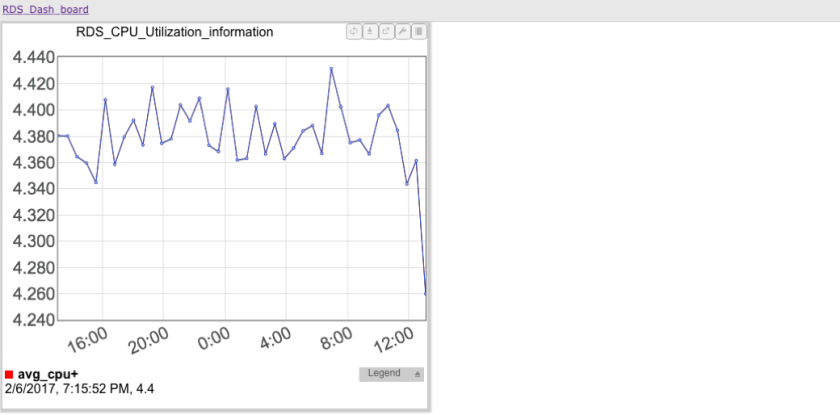
The following is a snapshot of RDS CPU utilization from EDB Postgres Enterprise Manager.
If you want to know more about Custom Alerts and Custom Dashboards, please use the following links:
Creating Custom Alerts templates
https://www.enterprisedb.com/docs/en/6.0.2/pemgetstarted/getting_started_guide.1.30.html#pID0E0E40HA
Creating Custom Alerts
https://www.enterprisedb.com/docs/en/6.0.2/pemgetstarted/getting_started_guide.1.30.html#pID0E0Z60HA
Creating Custom Charts
https://www.enterprisedb.com/docs/en/6.0.2/pemgetstarted/getting_started_guide.1.28.html#
Creating Custom Ops Dashboard
As you can see, the EDB Postgres Enterprise Manager is very flexible and customizable to meet specific needs.
Vibhor Kumar is Director, Solution Architecture at EnterpriseDB.
This post originally appeared on Vibhor's personal blog.