The Cache that Wasn’t: Optimizing Postgres for SELECT Performance

What’s the first thing that springs to mind when thinking about the word “cache”? For many of us who work with databases regularly, the first thought is usually to take the results of one query or another and stash them somewhere for later reference. As fast as Postgres may be, nothing beats local references, and if we have an in-memory storage layer of some kind, all the better.
Sometimes however, that kind of luxury is unavailable. Perhaps it’s a legacy application which resists all but the most trivial of internal modifications. Maybe the application stack is being simplified to reduce resource cost or remove potential failure conditions. Whatever the underlying reason, what happens if we don’t have a distinct cache between Postgres and a client-side application?
First of all, it doesn’t have to be a performance death sentence. Let’s talk about how we can successfully address this mighty conundrum.
The missing link
For those not fully familiar with how Postgres retrieves results, there are several layers. The query executor determines which indexes or table heap pages it needs and dispatches a request to the shared buffers. If these pages are unaccounted for, that counts as a cache miss, and Postgres then requests those same pages from the operating system. The operating system then has a chance to supply the pages from its filesystem page cache, and if that is a miss, it retrieves the pages from the underlying storage layer itself.
That’s a lot of opportunity for unexpected latency simply due to storage and cache states, but that’s not actually the underlying problem we need to address. Consider our query is aggregating one million rows into a single row of results. What happens when the same query is executed twice in succession? The exact same process. Even if no writes occurred since our previous statement, Postgres will send all one million rows through the CPU for aggregation again. Sorts happen again. Merges happen again. The entire execution plan is applied, as only the source data itself is cached in any meaningful way. Postgres rebuilds the entire result set from scratch every time.
This is hardly an ideal situation, especially if we’re attempting to operate without some kind of application-side cache. It’s even trivial to demonstrate.
A world without caches
Let’s start with a simplified set of two tables with a minimum of content rows. We’ll construct them in such a way that one table references only two rows in the other. Everything is handled through a primary key, and we have an ideal situation where we don’t have to worry about writes distracting storage from fulfilling read requests. This code should work on any Postgres version 13 or greater.
CREATE TABLE sys_login ( login_id TEXT NOT NULL PRIMARY KEY, email_addr TEXT NOT NULL, create_dt TIMESTAMPTZ NOT NULL ); CREATE INDEX idx_login_email_addr ON sys_login (email_addr); CREATE TABLE sys_login_event ( event_id TEXT NOT NULL PRIMARY KEY, login_id TEXT NOT NULL, event_code TEXT NOT NULL, event_msg TEXT NOT NULL, event_dt TIMESTAMPTZ NOT NULL ); CREATE INDEX idx_login_event_login_id ON sys_login_event (login_id);Why all TEXT columns? The login_id and event_id fields are intended to stand in as UUID columns. This is a very common design pattern in newer applications, or systems that want to avoid accidentally leaking a sequentially generated ID which can reveal important information about the underlying records. In any case, we just have an email address which links to related events which are categorized with a message payload.
Then we just need to introduce some data. Ten million email users should be sufficient:
INSERT INTO sys_login SELECT md5(a.id), format('%s@example.com', substring(md5(a.id), 1, 10)), CURRENT_DATE + INTERVAL '24h' * random() FROM generate_series(1, 10000000) a (id); INSERT INTO sys_login_event SELECT gen_random_uuid(), md5(a.id), upper(substring(md5(random()), 1, 4)), repeat(md5(random()), 10), CURRENT_DATE + INTERVAL '24h' * random() FROM generate_series(1, 10000000) a (id), generate_series(1, 2); VACUUM ANALYZE sys_login; VACUUM ANALYZE sys_login_event;While we admit using md5 for the “UUID” column in the login table is deliberately undermining the point of a UUID, consider it a stand-in. We need to make it possible to JOIN between the two tables in a way that always produces rows, and fully random UUIDs makes that somewhat difficult. It works for some of our other fake data though!
In any case, consider what happens if we invoke the following pgbench-compatible script for various client counts.
\set id random(1, 10000000) SELECT e.event_id, e.event_code, e.event_msg, e.event_dt FROM sys_login l JOIN sys_login_event e USING (login_id) WHERE l.email_addr = format('%s@example.com', substring(md5(:id), 1, 10)) ORDER BY e.event_dt DESC;Our test system is a VM with 8 CPU threads and 64GB of RAM. Even with 10 million and 20 million rows, these tables fit fully in RAM on a server of this size. Regardless, the TPS and latency numbers aren’t great. For reference, we executed 30-second runs for each client count on a Postgres 13 system.
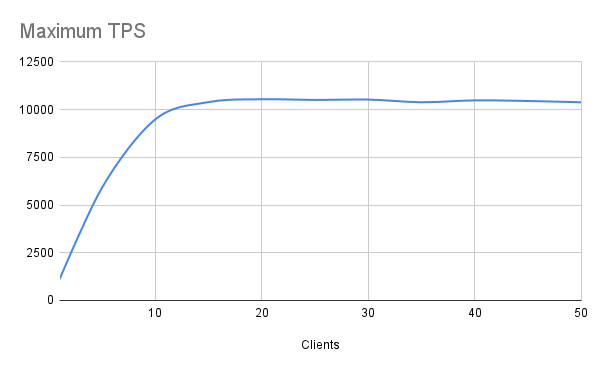
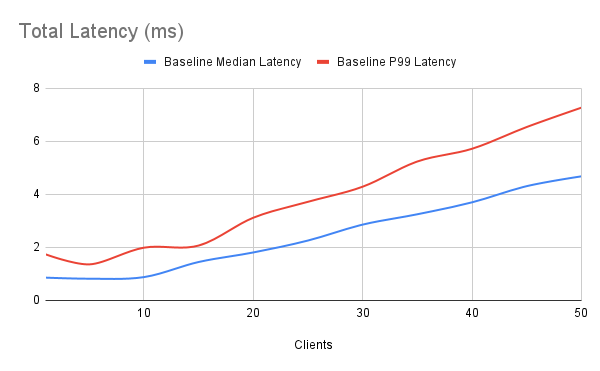
Toward the end of our benchmarks, observed latency was over 7.3ms for a mere 50 clients, and our TPS was a paltry 10,500 or so. This is to be expected given a spartan 8-core VM would start context-switching rather heavily past 10 clients, so we’re met with diminishing returns. Still, we would be in trouble with larger client counts, and throwing hardware at the problem isn’t necessarily the solution. And that raises an interesting question: what is?
Anticipated demand
Materialized views are an interesting and infrequently leveraged feature of Postgres. Some might argue that there’s a good reason for this. They don’t keep pace with the state of the underlying tables and require regular “refreshes” before they’re up to date. If we need our data to be the most recent state at all times, that’s not compatible with our requirements. A prior technique to the introduction of materialized views to Postgres was to use triggers instead. Inserts or updates into the underlying table would also update our “cached” copy.
This does introduce overhead to every INSERT or UPDATE statement however, and many are reluctant to deploy them as a result. But how much overhead? Consider this cache table and one trigger for each of our underlying source tables.
CREATE TABLE cache_login_events ( login_id TEXT NOT NULL, email_addr TEXT NOT NULL, event_id TEXT NOT NULL, event_code TEXT NOT NULL, event_msg TEXT NOT NULL, event_dt TIMESTAMPTZ NOT NULL ); CREATE INDEX idx_cache_event_login_id ON cache_login_events (login_id); CREATE INDEX idx_cache_event_email_addr ON cache_login_events (email_addr); CREATE OR REPLACE FUNCTION f_maintain_event_login_cache() RETURNS TRIGGER AS $$ BEGIN DELETE FROM cache_login_events WHERE login_id = NEW.login_id; INSERT INTO cache_login_events SELECT l.login_id, l.email_addr, e.event_id, e.event_code, e.event_msg, e.event_dt FROM sys_login l JOIN sys_login_event e USING (login_id) WHERE l.login_id = NEW.login_id; RETURN NULL; END; $$ LANGUAGE plpgsql; CREATE TRIGGER t_maintain_cache_by_login_a_iu AFTER INSERT OR UPDATE ON sys_login FOR EACH ROW EXECUTE FUNCTION f_maintain_event_login_cache(); CREATE TRIGGER t_maintain_cache_by_event_a_iu AFTER INSERT OR UPDATE ON sys_login_event FOR EACH ROW EXECUTE FUNCTION f_maintain_event_login_cache();The cache table isn’t especially complicated. It’s just capturing all the columns we return or reference in the WHERE clause of the original query. Also note that we’re not bothering to update records in the cache table. This is similar to how a front-end cache would work; we merely “invalidate” the cache by deleting old records, and by replacing them with whatever is current.
But how does it perform? Let’s take a look at the amount of time necessary to insert or update each new record. We can do that all at once with these statements which add an additional 1-million rows to our existing 10-million:
\timing on INSERT INTO sys_login SELECT md5(a.id), format('%s@example.com', substring(md5(a.id), 1, 10)), CURRENT_DATE + INTERVAL '24h' * random() FROM generate_series(10000001, 11000000) a (id); INSERT INTO sys_login_event SELECT gen_random_uuid(), md5(a.id), upper(substring(md5(random()), 1, 4)), repeat(md5(random()), 10), CURRENT_DATE + INTERVAL '24h' * random() FROM generate_series(10000001, 11000000) a (id), generate_series(1, 2);Note that we insert 2-million rows into the event table since we maintain two events per login.
Then we can update those same 1-million rows with these statements:
\timing on UPDATE sys_login SET create_dt = CURRENT_DATE + INTERVAL '24h' * random() FROM generate_series(10000001, 11000000) a (id) WHERE login_id = md5(a.id); UPDATE sys_login_event SET event_dt = CURRENT_DATE + INTERVAL '24h' * random() FROM generate_series(10000001, 11000000) a (id) WHERE login_id = md5(a.id);We included a previous run without the triggers to get the baseline insert performance. It’s difficult to account for performance metrics at this scale; even one million records at a time may be subject to any number of environmental effects and we can’t account for them all. But our timings suggest about 30-50 microseconds per insert or update, a further 30-50 microseconds of trigger overhead for the login table, and 70-90 on the event table.
In our particular case, since no records in the cache table exist until we insert into the event table, inserts to the login table have the least overhead. We can probably eliminate that trigger condition entirely. Updates are the slowest because the DELETE portion of the trigger actually has work to do. Beyond that though, this does effectively double or triple write times. If our application isn’t particularly sensitive to this, that could be an acceptable cost. We are talking about microseconds per action, after all. Even our slowest action, an update to the event table with trigger overhead, used 235s to absorb 2-million records.
Performance revised
So what do we gain for all of our trigger work? For one, it simplifies our query down to this:
SELECT event_id, event_code, event_msg, event_dt FROM cache_login_events WHERE email_addr = ? ORDER BY event_dt DESC;We plugged that into our pgbench test script and ran the tests again to see how much faster our read queries were without the extra row processing overhead. We put both sets of results in the same graphs to make the comparison easier.
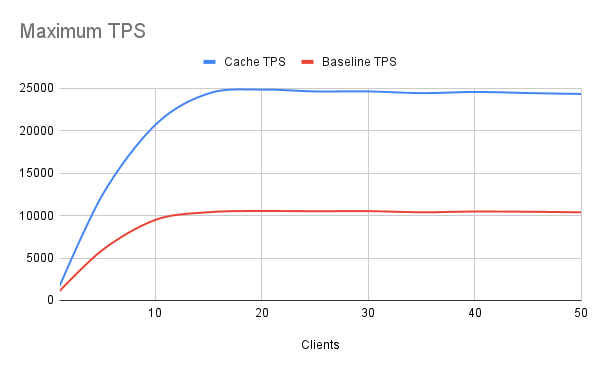
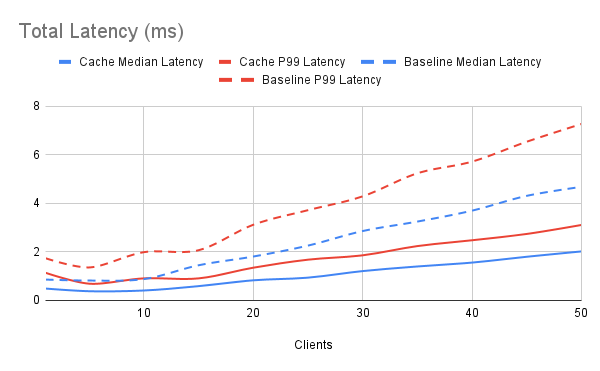
Based on these results, we’ve more than doubled our query throughput to about 25,000 TPS while similarly reducing worst-case P99 latency to 3.1ms. That’s a phenomenal result, and it actually gets better. This kind of precalculated cache scales spectacularly. Imagine if our source tables were extensively partitioned by day or even by month. With half a dozen partitions at minimum, this dramatically increases the cost of the query planner itself. In extreme cases, a large percentage of the total execution time could be from simply calculating the most efficient execution plan. And complicated plans may have to traverse multiple partitions as well.
Our cache table has neither of those problems; it’s just a single denormalized table. The more complicated our SELECT, the more benefit we stand to gain by caching the final result in an intermediate cache-like table. This was an extremely simplistic and contrived example and we still saw major improvements by doing a little extra work within the database.
Of course, maintaining several of these would eventually become cost-prohibitive from the cumulative trigger overhead, so some discretion is necessary. Applied judiciously, this kind of “fake” cache can partially compensate for the fact databases aren’t generally designed for heavy application-side workloads. We still recommend applications cache results locally and avoid unnecessary calls to the database whenever possible, but this approach can minimize the performance effects when that option isn’t available.
Postgres supplies the tools to make it possible!