Release Radar: Leverage Azure Monitor Workbooks for Your BigAnimal Clusters

If you’ve provisioned a BigAnimal cluster on Microsoft Azure infrastructure, you’re probably looking for the best ways to monitor its health and activity. Now you can use Azure Monitor Workbooks, specially configured for your BigAnimal clusters, to gain visibility into their operations.
Azure Monitor collects telemetry data on web applications, allowing for real-time visibility into performance metrics, usage, and alerts. Azure Monitor Workbooks allow you to build customizable dashboards using this data. We’ve built Workbooks for your BigAnimal clusters that are accessible directly from the Azure Portal with no need for you to take any extra steps. Let’s get into how to find and interpret the Workbook for your cluster.
Finding Your Workbook
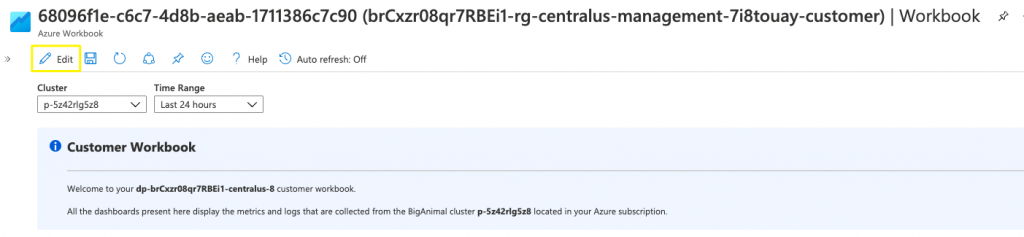
You can find the Azure Monitor Workbook for your BigAnimal cluster by following the instructions in our documentation. Your Workbook should have a similar layout as the following:
Interpreting the Workbook
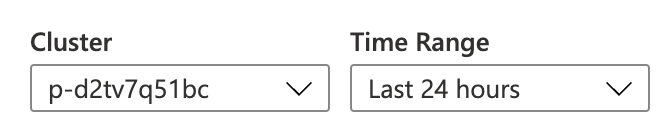
At all times when navigating in the Workbook, we can select the Cluster from the dropdown list. Changing the value here will automatically update all the panes of the workbook to match the chosen Cluster value. The same applies to the Time Range timepicker.
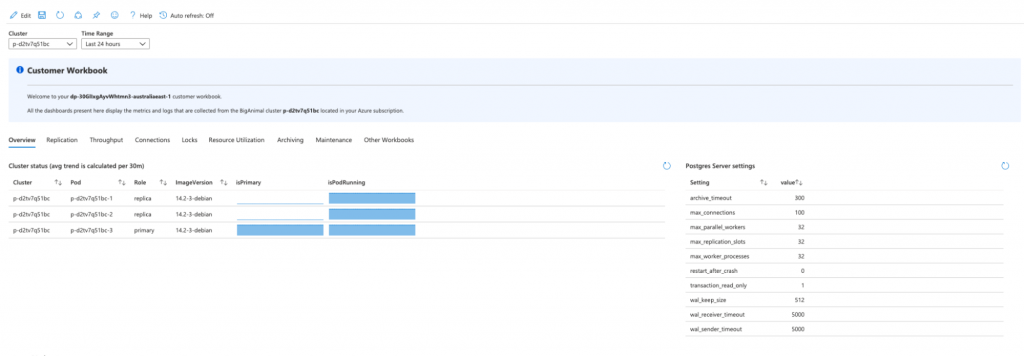
Once we open the workbook, we land on the Overview tab. This tab presents an overview of the selected cluster:
- Cluster status with version, pods and role information (primary/replica)
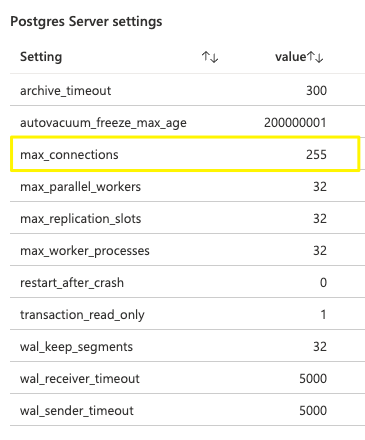
- Postgres server settings
- Latest Postgres logs in a table and its distribution over time
We can then navigate through all the available tabs:
- Replication: displays the replication bytes between the primary instance and the replica instances. This information is only available for clusters enabled with high availability (when the number of pod replicas for the cluster is greater than 1);
- Throughput: displays metrics about tuples (inserted, updated, deleted) and transaction duration;
- Connections: displays database connections graphs (active, idle and idle in transaction);
- Locks: displays deadlocks and conflicts metrics
- Resource Utilization: displays usage related to storage, CPU, memory, database and network;
- Archiving: displays WAL archiving successes and failures;
- Maintenance: displays autovaccum and manual vacuum metrics;
- Other Workbooks: displays all the built-in workbooks that are available under the customer’s subscription(s)
What Values to Look Out For
To monitor the state of your cluster, look out for the following values on each tab of your Workbook.
Overview tab
- “PostgreSQL logs”: If there are too many ERROR or FATAL messages in the logs, it could indicate a problem.
Connections tab
- “Number of maximum allowed database connections (current)”: If the value reaches 100%, no new connections can be created on the database as the pool of connections would be exhausted. You can monitor which type of connection is being mostly used by checking the graphs below this one. If you need to alter the maximum number of connections to your database, you can do so directly from the BigAnimal portal; the percentage on this graph will be updated accordingly. See our documentation for more on how to alter the number of connections.
Locks tab
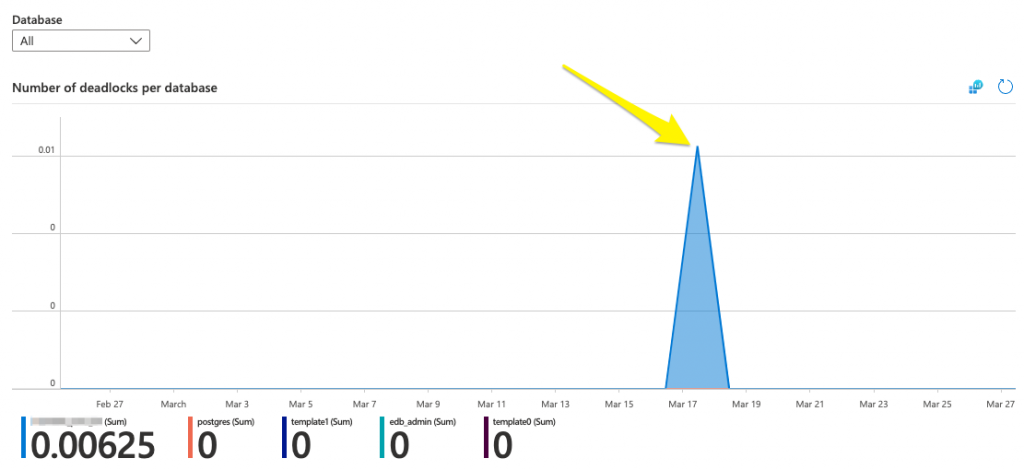
- “Number of deadlocks per database”: Any value above 0 is definitely not good. Deadlocks are two or more processes that can end up in a state in which each process is waiting for the other one.
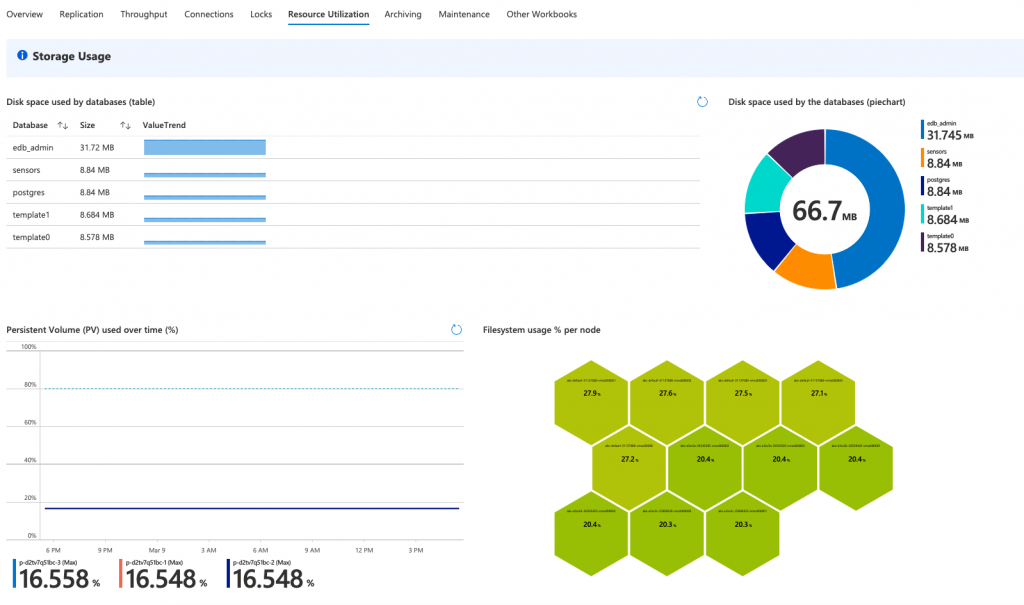
Resource Utilization tab
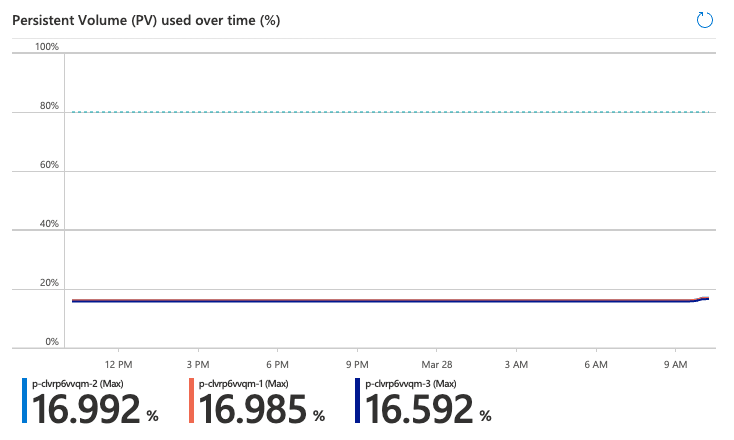
- “Persistent Volume (PV) used over time (%)”: Reaching 100% of the Persistent Volume means that the allocated storage for the Postgres cluster node has been exhausted and needs to be increased. See our documentation for more on how to scale storage in BigAnimal.
- “Filesystem usage % per node”: Reaching 100% on a node means that there is not enough storage available on the node to store anything.
- “CPU usage % per Postgres pod”: Reaching 100% means that the CPU will get throttled on that particular pod as it reaches the maximum CPU allocated to that pod.
- “CPU usage % per K8s node”: Reaching 100% on a node means that the CPU used by all the pods on the node and the consequence is that all the pods hosted on that particular node will be throttled in terms of CPU.
- “Memory usage % per K8s node”: Reaching 100% on a node means that the pods hosted on that particular node exhausted the pool of allocated memory.
Archiving tab
- “Last archiving failure (ago)”: This displays the last time the WAL files archiving failed.
- “Number of failed attempts for archiving WAL files”: This displays the distribution of the failed attempts for archiving WAL files.
Troubleshooting Unexpected Values
If the Postgres cluster is not behaving as expected, there might be something wrong. To better understand what is going on, here are some examples of graphs to check to identify if there is an ongoing problem:
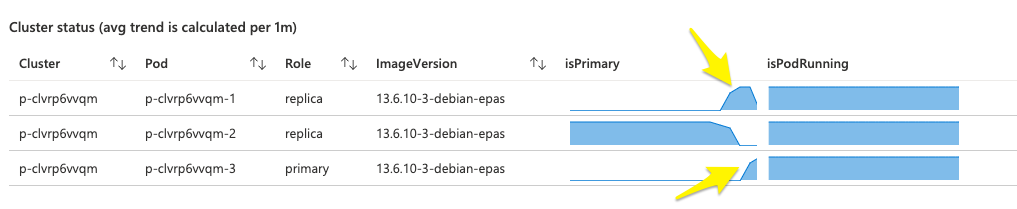
Multiple primary promotions in a short period of time
Seeing unwanted multiple primary Postgres instance promotions in a short period of time is a sign of something that is not right in the cluster. It shows that the current primary node is not healthy and the cluster tries to promote another instance as primary multiple times in a row, proving that the new primary is not healthy.
Number of maximum allowed database connections
Check the hive graph for the current ratio, and the graphs below for the distribution over time.

The percentages in the hive cells are calculated based on the latest value of the metric and the maximum number of connections from the Postgres settings.
If the number of connections reaches its maximum, no new connection to the cluster would be possible.
Number of database deadlocks
Any number of deadlocks greater than 0 is a problem.
Persistent Volume (PV) usage
Check the PV used over time to make sure there is enough storage allocated for your cluster. If that percentage is too high, you might run out of space and have to either clean up some of the data or request a storage increase.
Here is an example of a cluster where almost 17% of the cluster storage has been used; there is still some margin before it becomes a problem.
Customizing Your Workbook
The built-in Workbook that EDB created for you can be edited with the proper permissions, but any changes will be overwritten after each release. If you want to use this Workbook as a “template,” you can clone and rename it by following these steps:
- Open the Workbook.
- Click Edit.
- Click Save As, then specify a name for your Workbook.
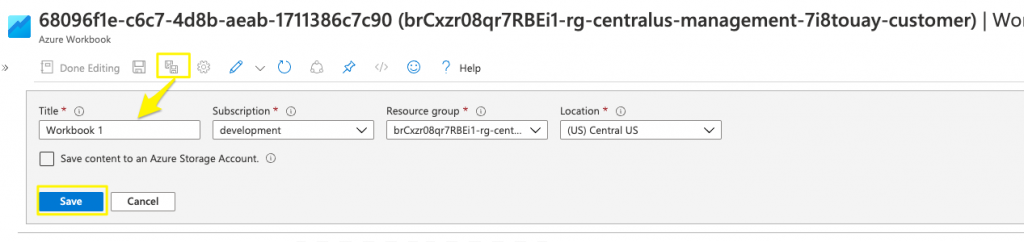
- Wait about 1 minute for Azure to clone the Workbook (there won’t be any progress bar anywhere).
- Return to the list of Workbooks on the Azure portal and your cloned Workbook should appear. If not, refresh the page until it appears.
You will be able to edit your cloned Workbook at their own will, but any improvements made to the Customer Workbook by EDB won’t be reflected in the cloned version. The opposite is also valid: any changes applied to the cloned Workbook won’t be overwritten by a BigAnimal release.
See also
KQL (Kusto Query Language) documentation
- Kusto Query Language (KQL) overview- Azure Data Explorer | Microsoft Docs
- KQL quick reference | Microsoft Docs
Workbook overview